Welcome to IgMin Research – an Open Access journal uniting Biology, Medicine, and Engineering. We’re dedicated to advancing global knowledge and fostering collaboration across scientific fields.
At IgMin Research, we bridge the frontiers of Biology, Medicine, and Engineering to foster interdisciplinary innovation. Our expanded scope now embraces a wide spectrum of scientific disciplines, empowering global researchers to explore, contribute, and collaborate through open access.
Welcome to IgMin, a leading platform dedicated to enhancing knowledge dissemination and professional growth across multiple fields of science, technology, and the humanities. We believe in the power of open access, collaboration, and innovation. Our goal is to provide individuals and organizations with the tools they need to succeed in the global knowledge economy.
IgMin Publications Inc., Suite 102, West Hartford, CT - 06110, USA
Near the turn of the 21st century, several climate scientists believed that rising CO2 was the cause of observed warming and sought to support this by showing that excursions in the Earth temperature were small for the past 2,000 years, with a sudden increase in the 20th century at the same time period when CO2 emissions increased (a so-called “hockey stick” shape to the temperature vs. time plot). To do this, they employed a large number of proxies (such as tree rings) to estimate the Earth’s temperature over the last 2,000 years. Each proxy was compared to the measured temperature during the calibration period (the 20th century), and this relationship was used to convert up to 2,000 years of proxy measurements to estimated temperature. A sophisticated algorithm was used to process the large amount of data from multiple proxies into a yearly average temperature for up to 2,000 years. Unfortunately, they made several mistakes in the statistical analysis, one of which produced a significant statistical error. This error, in which they standardized the data against the mean during the calibration period (rather than the entire data set) had the effect of almost ignoring most of the proxies, while heavily weighting those few with an increase in the 20th century – thus artificially producing a hockey stick form to the plot of temperature vs. time. In addition, the innate merit of many proxies is dubious. The climate scientists involved appeared to ignore valid criticisms from outside their peer group, and they continued to claim the hockey stick result. Climate scientists also vigorously opposed any suggestion that factors other than CO2 also affected the climate. Climate scientists introduced elements of political influence into scientific discourse by actions such as loading up a thin paper with a large number of authors – publishing votes of confidence rather than scientific results.
There is good evidence that on average, the Earth had warmed by roughly 0.6 C around year 2000 since the 1800s. It is widely believed that this was due to increased greenhouse gas concentrations in the atmosphere, mainly CO2, due to emissions from the industrialized world. The attribution of the warming to rising CO2 rests mainly on the fact that the warming took place over the same period that emissions increased – a correlation, but not definitive evidence of cause-and-effect. As this correlation grew stronger near the end of the 20th century, there arose a worldwide movement to support policies and technologies to reduce emissions and thereby avoid or reduce predicted global calamities that might result from unlimited future emissions. Today, there is widespread agreement that emissions of CO2 from human activity are the primary cause of global warming via the greenhouse gas effect, and serious consequences may result as we continue to emit.
The Earth’s climate is not determined by greenhouse gases alone, and other factors such as variability of the Sun, changes in land use, and many more factors can also affect climate. Therefore, climate scientists have sought further proof that rising CO2 is indeed the major cause of recent global warming.
One possible approach to show the importance of CO2 is to estimate the average global temperature over the last 1,000 to 2,000 years, assuming we’ve been in a relatively stable period, and if the temperature flatlined for about 1,900 years and suddenly went up in the last century or so as CO2 increased, that would provide further support for CO2 as the driver for climate change. This is still only a correlation, but a much stronger one than a correlation that is limited to only the last 100 years. The idea was to show a “hockey stick” form for the data, and some climatologists set about seeking historical temperature data in the hockey stick form (Figure 1).
Figure 1: The idealized hockey stick.
Several climate scientists in close contact with one another specialized in the study of the Earth’s climate over the past millennia or two. The method was based on so-called “proxies”. A proxy is some observable quantity in nature that lasts a very long time, such as tree rings, that is believed to show structure year after year, dependent on temperature. Thus, cutting down an ancient tree and inspecting the spacing and coloring ring by ring, might provide an indication of the yearly temperature over its life. There is a “calibration period” during which the known climate and the tree rings (or other proxies) are compared to establish a relationship between climate and tree ring properties. This is extrapolated far into the past, beyond which temperature data is available, and the tree rings are used to estimate the climate in early times. This is illustrated in Figure 2.
Figure 2: The correlation between proxy and measured temperature over the last 100 years is extrapolated back in time to infer the ancient temperature from the proxy.
There are many other proxies besides tree rings. It is assumed (without proof) that the current relationship between proxy and local temperature also holds in the distant past, and from this, past temperatures are estimated prior to the calibration period. The two fundamental problems with this method are:
(1) The proxies tend to be noisy and the correlation between climate and proxy signal is often tenuous. (It is notable that some published papers don’t show the actual correlation during the calibration period, while others show only a tiny one-inch graph). The agreement between proxy and temperature in the calibration period is rarely made clear.
(2) Extrapolation of the relationship between proxy and climate from recent times to earlier times assumes that nothing changed with time, which is sometimes not the case. In particular, the calibration period was one of rising temperatures, which might make it somewhat unique.
Prior to 1998, several published papers provided estimates of past climate based on specific proxies at limited locations over limited timescales. In 1998 and 1999, Mann, Bradley and Hughes (MBH) published a pair of landmark papers that gathered together many available proxies, and performed a sophisticated statistical analysis to obtain an estimate of the yearly average Earth climate as far back as 2,000 years prior to the present day [11Mann ME, Bradley RS, Hughes MK. Global-scale temperature patterns and climate forcing over the past six centuries. Nature. 1998 Apr 23;392(6678):779–87. https://doi.org/10.1038/33859.,22Mann ME, Bradley RS, Hughes MK. Northern Hemisphere temperatures during the past millennium: Inferences, uncertainties, and limitations. Geophys Res Lett. 1999 Apr 1;26(6):759–62. https://doi.org/10.1029/1999GL900070.]. There followed several similar studies by other teams who carried out statistical analysis of multiple proxies, each of which covered limited areas for limited time periods, yielding (hopefully) an estimate of global or NH average temperature for each year over 1,000 to 2,000 years. These various studies were reviewed by Rapp [33Rapp D. Assessing climate change. 3rd ed. Heidelberg (Germany): Springer-Praxis Books; 2018.].
While the idea of combining many proxies into one large dataset was inspirational, the actual execution of these statistical studies was problematic for several reasons:
The published papers are terse, full of jargon, and difficult to follow.
The descriptions of the work are inadequate and the original data is not readily available, and therefore the results are difficult to be reproduced by others, as is required by the scientific method.
Some scientists made it very difficult for others to obtain access to their basic data as is required by the scientific method.
The number of proxies fell off sharply with age. By 1,000 years ago, only a mere 12 proxies remained in the original work.
The yearly pattern of proxies differed very widely from proxy to proxy, indicating that climate change measured by different proxies showed inconsistencies, raising concerns about the method’s reliability, or that a very large number of proxies is needed to represent the whole Earth over the entire time period, with all the multitude of local variations.
The detailed correlation of climate with proxy signal during the calibration period was rarely shown, so the validity of any proxy signal as a representation of climate was difficult to assess.
In one case of certain important tree rings, the proxy went down while the temperature went up late in the calibration period. This was addressed using a controversial approach later referred to as ‘hide the decline.’
Of greatest importance of all, the statistical methods used to process the data had significant flaws. These flaws artificially produced a hockey stick graph that is unscientific. The flaws will be discussed in sections that follow.
Further discussion is provided in the sections that follow.
MBH and other publications on millennial climate
The Mann, Bradley, and Hughes (MBH) studies: Realizing that there exist numerous proxies with variable spatial and temporal extent, Mann, Bradley, and Hughes (1998, 1999) attempted a comprehensive analysis of the millennial history of global average temperatures using a multi-proxy network consisting of “widely distributed high-quality annual-resolution proxy climate indicators, individually collected and formerly analyzed by many paleoclimatic researchers” [11Mann ME, Bradley RS, Hughes MK. Global-scale temperature patterns and climate forcing over the past six centuries. Nature. 1998 Apr 23;392(6678):779–87. https://doi.org/10.1038/33859.,22Mann ME, Bradley RS, Hughes MK. Northern Hemisphere temperatures during the past millennium: Inferences, uncertainties, and limitations. Geophys Res Lett. 1999 Apr 1;26(6):759–62. https://doi.org/10.1029/1999GL900070.]. The network included annual resolution dendro-climatic, ice core, ice melt, and long historical records previously assembled, as well as other coral, ice core, dendro-climatic, and long instrumental records. This was intended to integrate as many proxy sources as possible into a single comprehensive view of how a single global average temperature (or NH average temperature) varied over the past millennium or two. Several subsequent related studies were also published by the same group, as well as by other allied groups. The final results were reconstructions of a single NH or global average temperature over the past one or two millennia with a so-called hockey stick structure: a relatively flat profile for most of the millennium, prior to the 20th century, with a significant rise in the 20th century.
The pair of papers by Mann, Bradley, and Hughes (1998) and Mann, Bradley, and Hughes (1999) are referred to as “MBH” after the names of the three authors [11Mann ME, Bradley RS, Hughes MK. Global-scale temperature patterns and climate forcing over the past six centuries. Nature. 1998 Apr 23;392(6678):779–87. https://doi.org/10.1038/33859.,22Mann ME, Bradley RS, Hughes MK. Northern Hemisphere temperatures during the past millennium: Inferences, uncertainties, and limitations. Geophys Res Lett. 1999 Apr 1;26(6):759–62. https://doi.org/10.1029/1999GL900070.]. The 1999 paper extended the period of analysis from 1400 back to 1000, and Mann and Jones (2003) added most of an additional millennium back to 200 [44Mann ME, Jones PD. Global surface temperatures over the past two millennia. Geophys Res Lett. 2003 Jul 1;30(15):1820. https://doi.org/10.1029/2003GL017814.]. Mann, et al. (2008) updated previous results [55Mann ME, Zhang Z, Hughes MK, Bradley RS, Miller SK, Rutherford S, Ni F. Proxy-based reconstructions of hemispheric and global surface temperature variations over the past two millennia. Proc Natl Acad Sci U S A. 2008 Sep 9;105(36):13252-7. doi: 10.1073/pnas.0805721105. Epub 2008 Sep 2. PMID: 18765811; PMCID: PMC2527990.]. There are also several other relevant papers by other investigators.
MBH is a compact paper, full of jargon, and difficult to follow. However, this is a characteristic shared by many papers that deal with large data sets for historic Earth temperatures.
The final results from Mann, Bradley, and Hughes (1998) are shown in Figures 3,4. Note that the mean is the mean for the calibration period 1902–1980, and therefore most of the data (1400–1920) are negative and lie below the mean. (We will have more to say about this in the following sections.) These so-called hockey stick figures were published in subsequent papers with a relatively flat profile prior to 1900 and a sudden rise after 1900. Note that the “X” at the far right of Figure 4 is meant to be the current temperature. As shown, it is 1.1 °C higher than the 1895 temperature, whereas it is widely believed that this temperature differential around year 2000 was more like 0.6 °C. This exaggerated the blade of the hockey stick. Furthermore, this is not the result of modeling with proxies. It is a superposition of measured trend that confuses the issue.
11Mann ME, Bradley RS, Hughes MK. Global-scale temperature patterns and climate forcing over the past six centuries. Nature. 1998 Apr 23;392(6678):779–87. https://doi.org/10.1038/33859.]. Note that the mean is for 1902–1980. Also note that the 2σ error bars are so wide that they could hide almost any imaginable temperature curve [11Mann ME, Bradley RS, Hughes MK. Global-scale temperature patterns and climate forcing over the past six centuries. Nature. 1998 Apr 23;392(6678):779–87. https://doi.org/10.1038/33859.]." /> Figure 3: Reconstructed temperatures since 1400 [11Mann ME, Bradley RS, Hughes MK. Global-scale temperature patterns and climate forcing over the past six centuries. Nature. 1998 Apr 23;392(6678):779–87. https://doi.org/10.1038/33859.]. Note that the mean is for 1902–1980. Also note that the 2σ error bars are so wide that they could hide almost any imaginable temperature curve [11Mann ME, Bradley RS, Hughes MK. Global-scale temperature patterns and climate forcing over the past six centuries. Nature. 1998 Apr 23;392(6678):779–87. https://doi.org/10.1038/33859.].
22Mann ME, Bradley RS, Hughes MK. Northern Hemisphere temperatures during the past millennium: Inferences, uncertainties, and limitations. Geophys Res Lett. 1999 Apr 1;26(6):759–62. https://doi.org/10.1029/1999GL900070.]. The X at the far right is their estimate for 1998. Note that the mean is for 1902–1980." /> Figure 4: Temperature anomaly vs. year since AD 1000. Adapted from Mann, Bradley, and Hughes [22Mann ME, Bradley RS, Hughes MK. Northern Hemisphere temperatures during the past millennium: Inferences, uncertainties, and limitations. Geophys Res Lett. 1999 Apr 1;26(6):759–62. https://doi.org/10.1029/1999GL900070.]. The X at the far right is their estimate for 1998. Note that the mean is for 1902–1980.
Mann and Jones (2003) extended the work of Mann, Bradley, and Hughes (1998, 1999) back to year 200. Their result is similar to that shown in Figure 4 with the addition of very little change in temperature from year 200 to year 1000. Taken at face value, these figures would suggest: (1) there was no Medieval Warm Period, (2) there was a very minor Little Ice Age, (3) Earth temperatures have been remarkably stable for 2,000 years, and (4) the only significant change in Earth temperature took place in the 20th century with a sudden and decisive sharp rise after 1900. That would provide additional evidence of the importance of CO2. However, MBH chose the mean for the calibration period (1902–1980) rather than the mean for the entire data set. As we shall see, this had major repercussions regarding the form and credibility of the result.
In a more recent paper, Mann, et al. (2008) updated their previous work by including additional proxies of various types [55Mann ME, Zhang Z, Hughes MK, Bradley RS, Miller SK, Rutherford S, Ni F. Proxy-based reconstructions of hemispheric and global surface temperature variations over the past two millennia. Proc Natl Acad Sci U S A. 2008 Sep 9;105(36):13252-7. doi: 10.1073/pnas.0805721105. Epub 2008 Sep 2. PMID: 18765811; PMCID: PMC2527990.]. The spatial distribution of these was heavily concentrated in the U.S. and Europe (about 85%) with very few in the rest of the world (about 15%). As is usual in papers authored by Mann and co-workers, the paper presents complex data that may require additional explanation. Oceans, which cover 70% of the Earth, were claimed to be included in some of the studies but it is not clear how ocean temperatures from a thousand years ago were obtained and averaged over all the oceans—if indeed that was done. It is difficult to understand how they incorporated ocean data from the terse description given in the paper. Of the 1,209 proxies utilized, 59 extended back 1,000 years and 25 extended back 2,000 years from the present. The mean duration of a proxy was about 270 years. Some of their reconstructions utilized all proxies, and some were restricted to a subset of proxies that passed “a screening process for a local surface temperature signal. The screening process required a statistically significant correlation with local instrumental surface temperature data during the calibration interval.” The period 1850–1995 was used for calibration.
When the proxies used by Mann, et al. (2008) from various regions are compared, the differences between proxies are huge compared to the similarities [55Mann ME, Zhang Z, Hughes MK, Bradley RS, Miller SK, Rutherford S, Ni F. Proxy-based reconstructions of hemispheric and global surface temperature variations over the past two millennia. Proc Natl Acad Sci U S A. 2008 Sep 9;105(36):13252-7. doi: 10.1073/pnas.0805721105. Epub 2008 Sep 2. PMID: 18765811; PMCID: PMC2527990.]. Figure 5 shows some of the proxies that were utilized. The variability among proxies appears to obscure any underlying consistent signal that may underlie these time series. Hence this set of time series represents a dataset with low signal-to-noise ratio.
As we will show further in this paper, the papers by Mann, et al. (as well as by others) were subjected to serious criticism by McIntyre and McKitrick (M&M) in a series of Internet postings plus a pair of papers. Of greatest importance is the fact that use of the mean for the calibration period (rather than for the whole data set) led to the statistics algorithm “mining” for the few proxies that rose in the 20th century, thus producing a “hockey stick” shape from a set of proxies shown in Figure 5. These authors made no reference to any of the criticisms by M&M, apparently ignoring them completely, and continued to improperly use the mean from the calibration period. Indeed, throughout the history of publications on proxy estimates of past temperatures, none of the many authors seem to have ever referred to the criticisms of M&M.
55Mann ME, Zhang Z, Hughes MK, Bradley RS, Miller SK, Rutherford S, Ni F. Proxy-based reconstructions of hemispheric and global surface temperature variations over the past two millennia. Proc Natl Acad Sci U S A. 2008 Sep 9;105(36):13252-7. doi: 10.1073/pnas.0805721105. Epub 2008 Sep 2. PMID: 18765811; PMCID: PMC2527990.]." /> Figure 5: Some of the proxies used by Mann, et al. [55Mann ME, Zhang Z, Hughes MK, Bradley RS, Miller SK, Rutherford S, Ni F. Proxy-based reconstructions of hemispheric and global surface temperature variations over the past two millennia. Proc Natl Acad Sci U S A. 2008 Sep 9;105(36):13252-7. doi: 10.1073/pnas.0805721105. Epub 2008 Sep 2. PMID: 18765811; PMCID: PMC2527990.].
Other studies: A number of other groups published reconstructions of historical temperatures using similar methods. For example, Jones, Osborn, and Briffa (2001) obtained comparable results using similar data processing schemes [66Jones PD, Osborn TJ, Briffa KR. The evolution of climate over the last millennium. Science. 2001 Apr 27;292(5517):662-7. doi: 10.1126/science.1059126. PMID: 11326088.]. It is particularly noteworthy that Jones, Osborn, and Briffa (2001) decided not to show some tree ring proxy data late in the 20th century because it ticked sharply downward and conflicted with the desire to emphasize recent global warming. Esper, et al. (2005) discussed differences between various reconstructions based primarily on tree rings and presented a comparison [77Esper J, Wilson RJS, Frank DC, Moberg A, Wanner H, Luterbacher J. Climate: Past ranges and future changes. Quat Sci Rev. 2005;24(18–19):2164–6. https://doi.org/10.1016/j.quascirev.2005.07.001.]. There was considerable variation in amplitude of the putative MWP and the LIA from study to study.
Moberg, et al. (2005) indicated that the result with relatively small variability prior to the 20th century and a sharp rise in the 20th century (i.e., the hockey stick) “is arguably best known by a wider audience. One reason for this is the prominent role that the multi-proxy reconstruction by MBH had in the latest IPCC report and in public media” [88Moberg A, Sonechkin DM, Holmgren K, Datsenko NM, Karlén W, Lauritzen SE. Highly variable Northern Hemisphere temperatures reconstructed from low- and high-resolution proxy data. Nature. 2005 Feb 10;433(7026):613-7. doi: 10.1038/nature03265. Erratum in: Nature. 2006 Feb 23;439(7079):1014. Lauritzen, Stein-Erik [added]. PMID: 15703742.]. However, they went on to point out that recent findings suggested that considerable underestimation of centennial Northern Hemisphere temperature variability may result when regression-based methods (like those used by MBH) are applied to noisy proxy data with insufficient spatial representation. Moberg, et al. (2005) also referred to well-documented difficulties in reliably reproducing multi-centennial temperature variability based on tree ring proxies [88Moberg A, Sonechkin DM, Holmgren K, Datsenko NM, Karlén W, Lauritzen SE. Highly variable Northern Hemisphere temperatures reconstructed from low- and high-resolution proxy data. Nature. 2005 Feb 10;433(7026):613-7. doi: 10.1038/nature03265. Erratum in: Nature. 2006 Feb 23;439(7079):1014. Lauritzen, Stein-Erik [added]. PMID: 15703742.]. von Storch, et al. (2004) used a coupled atmosphere–ocean model simulation of the past 1,000 years to test empirical reconstructions of historical temperatures, specifically those of MBH [99von Storch H, Zorita E, Jones JM, Dimitriev Y, González-Rouco F, Tett SF. Reconstructing past climate from noisy data. Science. 2004 Oct 22;306(5696):679-82. doi: 10.1126/science.1096109. Epub 2004 Sep 30. PMID: 15459344.]. They claimed that centennial variability of the NH temperature is underestimated by the MBH regression-based methods. Their results also suggested that actual centennial variability may have been at least twice as large as the variability obtained in the MBH studies. Juckes, et al. (2006, 2007) provided an extensive survey of a number of recent temperature reconstructions based on proxies [1010Juckes MN, Allen MR, Briffa KR, Esper J, Hegerl GC, Moberg A, Osborn TJ, Weber SL, Zorita E. Millennial temperature reconstruction intercomparison and evaluation. Clim Past Discuss. 2006;2:1001–49.,1111Juckes MN, Allen MR, Briffa KR, Esper J, Hegerl GC, Moberg A, Osborn TJ, Weber SL, Zorita E. Millennial temperature reconstruction intercomparison and evaluation. Clim Past. 2007;3:591–609.]. Juckes, et al. (2006) presented a number of graphs of reconstructions of historical temperatures. However, all of these were based on MBH-type models in which the mean was chosen only for the calibration period (20th century) and as a result, almost all of the temperature data are negative and lie below the mean.
A comparison of the results of Mann, et al. (2008) with results of other models shows wide variation from model to model (Figure 6). The calibration period was from 1850 to 2002. These plots show that almost any pattern can be obtained for the past climate from proxies. It is also important to note that the red curves in this figure were added by Mann, et al. and these don’t belong in the figure because the actual temperature is shown by the black dashed line.
55Mann ME, Zhang Z, Hughes MK, Bradley RS, Miller SK, Rutherford S, Ni F. Proxy-based reconstructions of hemispheric and global surface temperature variations over the past two millennia. Proc Natl Acad Sci U S A. 2008 Sep 9;105(36):13252-7. doi: 10.1073/pnas.0805721105. Epub 2008 Sep 2. PMID: 18765811; PMCID: PMC2527990.]. Mann, et al. exaggerated the temperature rise at the far right. The actual temperature change is shown as a black dashed line. In either case, substituting measured temperature for modeled temperature hides the model where it fails." /> Figure 6: Estimates of historical temperatures by Mann, et al. and others [55Mann ME, Zhang Z, Hughes MK, Bradley RS, Miller SK, Rutherford S, Ni F. Proxy-based reconstructions of hemispheric and global surface temperature variations over the past two millennia. Proc Natl Acad Sci U S A. 2008 Sep 9;105(36):13252-7. doi: 10.1073/pnas.0805721105. Epub 2008 Sep 2. PMID: 18765811; PMCID: PMC2527990.]. Mann, et al. exaggerated the temperature rise at the far right. The actual temperature change is shown as a black dashed line. In either case, substituting measured temperature for modeled temperature hides the model where it fails.
As we have pointed out, generally, the published papers on reconstruction of millennial temperatures tend to be very terse and full of jargon. The MBH papers are particularly bad in this respect. These papers present their results in small graphs with poor resolution but provide little insight into the calibration periods of specific proxies. Comparison of proxies with temperatures during the calibration period are rarely provided and probably for good reason; the comparison might show a great many scribbles?
The work by Esper, Cook, and Schweingruber (2002) is discussed in a later section because it is relevant to the choice of mean for standardizing the data [1212
Esper J, Cook ER, Schweingruber FH. Low-frequency signals in long tree-ring chronologies for reconstructing past temperature variability. Science. 2002 Mar 22;295(5563):2250-3. doi: 10.1126/science.1066208. PMID: 11910106.].
The only way to really understand what was done is to go back to their original data and follow the original procedures. As more and more of these reconstructions appeared in the literature with their typical hockey stick results, McKitrick (2005) and McIntyre and McKitrick (2005, 2006, 2007) took it upon themselves to review these reconstructions by working with the original data in detail [1313Ross M. What is the ‘Hockey Stick’ Debate About?, 2005. online at https://www.rossmckitrick.com/uploads/4/8/0/8/4808045/mckitrick-hockeystick.pdf-1818McIntyre S, McKitrick R. The M&M Critique of the MBH98 Northern Hemisphere Climate Index: Update and Implications, Informal report. 2007. online at https://www.rossmckitrick.com/uploads/4/8/0/8/4808045/m_m.ee2005.pdf]. These original studies by McIntyre and McKitrick continue to this day in the form of sporadic entries on the blog: climateaudit.org [1919McIntyre S. Climate Audit Website. 2025. online at http://www.climateaudit.org]. The first obstacle they ran into was obtaining the data from the authors. Publications in journals are highly compressed and do not provide adequate means for others to reproduce the claimed results of the paper. Some journals require that authors archive the detailed data for access by the public but this is rarely enforced. Sensing that McIntyre and McKitrick (M&M) were antithetical to the hockey stick results, authors of papers on reconstruction of millennial temperatures resisted providing M&M with data and script from their work. Evidently, they were defensive about their work and did not cooperate in allowing their work to be checked. When M&M utilized the Freedom of Information Act (FOIA) in an attempt to obtain data generated by government-funded work in the U.S. and England, some authors sought assistance from policy figures to contest FOIA requests. This is discussed at length in Section 4.
The Medieval Warm Period (MWP) and the Little Ice Age (LIA)
There is both anecdotal evidence and climatological evidence from some individual proxies that indicates that the Earth’s climate (or at least the NH climate) was not constant over the past 1,000 years, even though the concentration of CO2 in the atmosphere is believed to have remained within a narrow range near 275 ppm. There was likely a Medieval Warm Period (MWP) from about year 800 to 1200, followed by a cold period referred to as a so-called “Little Ice Age” intermittently between very roughly 1500 and 1850. The term is somewhat misleading because this was merely a slightly colder period and in no way resembled a true ice age [33Rapp D. Assessing climate change. 3rd ed. Heidelberg (Germany): Springer-Praxis Books; 2018.]. Several climate scientists, intent on demonstrating that the climate is almost entirely driven by CO2 concentration, argued against existence of the LIA and MWP. Rapp (2018) provided a review of arguments for and against [33Rapp D. Assessing climate change. 3rd ed. Heidelberg (Germany): Springer-Praxis Books; 2018.].
Fagan (2000) provided many anecdotal descriptions of the climate during the MWP and the LIA [2020Brian F. The Little Ice Age, Basic Books. 2000.]. There are anecdotal indications that the MWP was warmer than any period that followed it (e.g., grapes suitable for wine-making were reportedly grown in England, and the tree line in Scandinavia was 100 m–200 m higher than it is at present (Crowley and Lowery, 2000) [2121Crowley TJ, Lowery TS. How warm was the Medieval Warm Period? Ambio. 2000;29(1):51–4. https://doi.org/10.1579/0044-7447-29.1.51.]. The degree of warmth in the MWP remains uncertain. There is considerably better anecdotal evidence that the so-called LIA that followed the MWP was considerably colder than the MWP, although there are uncertainties as to how consistently cold and how widespread the LIA was.
Grove (1998) provided 1,000 pages of evidence for the LIA [2222Grove JM. The Little Ice Age, Routledge, London, UK. 1988.]. Grove (2001) asserted that a great amount of information about the LIA can be gleaned from the Swiss Alps where historical records are unusually rich and moraine dating is good [2323Grove JM. The initiation of the ‘Little Ice Age’ in regions around the North Atlantic, Climatic Change. 2001; 48:53–82.]. Many ice fronts extended below the current tree line and were in full view of settlements for hundreds of years, or even abutted onto farmland. Written records, paintings, and drawings made by both local observers and visitors are plentiful. Identification of the calendar dates at which many in situ trees were killed by advancing ice, together with their ages at death, has been made possible by multiple dendro-chronological analyses.
A number of independent proxy studies show evidence of distinct MWP and LIA. Table 1 lists several studies that used single proxies to find evidence for a MWP and LIA.
Table 1: Evidence of MWP and LIA from proxy studies.
The website: http://co2science.org/data/mwp/mwpp.php provides an extensive list of peer-reviewed scientific journal articles pertaining to the MWP, and provides brief summaries of the findings of each paper. The locations of these studies are plotted on an interactive map of the globe.
In the past decade, some climatologists emphasized the lack of uniformity in evidence for the MWP and the LIA, and thereby attacked the very notions of the MWP and the LIA, arguing either that they were regional, minor, and variable, or in some cases they were claimed to be non-existent.
It is understood that neither the LIA nor the MWP were periods of unbroken cold and warmth, respectively. Climate probably varied on moderate scales both spatially and temporally, as it has also in the 20th and 21st centuries. Nevertheless, climatic conditions may have been such during the LIA that mass balances were sufficient for the glaciers to remain predominantly enlarged, although their fronts oscillated. Similarly, during the MWP climatic conditions would have caused the volumes of glaciers to be reduced, so that they retracted substantially, although their fronts no doubt fluctuated, as they have been observed to do during the warming of the 20th century.
Soon and Baliunas (2003a, b) carried out a qualitative study of a number of proxies that indicated that the LIA and the MWP existed as distinguishable climatic anomalies in almost all regions of the world that were assessed [3737Soon W, Baliunas S. Lessons and limits of climate history: Was the 20th century climate unusual? Informal report. Washington (DC): George C. Marshall Institute; 2003.,3838Soon W, Baliunas S. Reconstructing climatic and environmental changes of the past 1000 years: A reappraisal. Energy Environ. 2003;14(3):233–99. https://doi.org/10.1260/095830503765184619]. Furthermore, they concluded that most of the proxy records did not suggest the 20th century climate to be the warmest or the most extreme climate.
The reaction of the paleoclimatic community was quick and forceful (See Section 5 for a description of the paleoclimatic community). In a series of emails that were not revealed until they were hacked in November 2011, paleoclimatic community members strategized to repair the “damage” from the Soon and Baliunas paper. (If the climate could vary that much while the CO2 concentration was flat, that would be contrary to their persuasion that CO2 and only CO2 controlled the climate). In one email from Malcolm Hughes to a dozen members of the paleoclimatic community, he cautioned that “an appeal to the National Academy of Sciences (NAS) could be counterproductive – remember the poor treatment of high-res paleo in the NAS report requested by the White House the other year” [referring to the Wegman Report that was sanctioned by the NAS – see Section 7]. Michael Mann in his usual arrogant stance referred to “two awful papers written by those clowns.” Mann also referred to their paper as “an assault on the science of climate change”. The outcome of this exchange was the publication Mann, et al. (2003) that rejected the arguments of Soon and Baliunas. This publication had 13 co-authors and it is unimaginable that it took 13 scientists to write that paper [3939Mann M, Ammann C, Bradley R, Briffa K, Jones P, Osborn T, Crowley T, Hughes M, Oppenheimer M, Overpeck J, Rutherford S, Trenberth K, Wigley T. Response to Soon et al's comment on 'On past temperatures and anomalous late-20th century warmth'. Eos. 2003 Oct 28;84(44):473–6.. https://doi.org/10.1029/2003EO440008].
This report was authored by the following members of the paleoclimatic community: Michael Mann, Caspar Ammann, Kevin Trenberth, Raymond Bradley, Keith Briffa, Philip Jones, Tim Osborn, Tom Crowley, Malcolm Hughes, Michael Oppenheimer, Jonathan Overpeck, Scott Rutherford, and Tom Wigley. The report was not made public at first, but was available only to journalists. Dozens of websites blared this headline: “Leading Climate Scientists Reaffirm View that Late 20th Century Warming Was Unusual and Resulted from Human Activity” but few details were revealed. It is not clear why 13 contributors were necessary to write this thin paper, except as a vote of confidence. This suggests that they acted in concert as a group to repair the “damage”. The point was: 13 scientists can hardly be wrong? This has been interpreted as an example of group endorsement in scientific publishing.
Crowley and Lowery (2000) argued that anecdotal reports as well as studies of individual records from MWP suggested that the present warmth of the 20th century is not unusual and therefore some might claim that temperatures can vary independent of CO2 concentration [4040Crowley TJ, Lowery TS. How warm was the Medieval Warm Period? Ambio. 2000;29(1):51–4. https://doi.org/10.1579/0044-7447-29.1.51.]. But Crowley and Lowery then asked the question: “Were all of these changes synchronous, with hemispheric amplitudes comparable to or warmer than present?” However, this question seems to imply that present warming is spatially universal and synchronous—which it is not. Crowley and Lowery revisited the controversy regarding the existence of the putative MWP by carrying out another proxy analysis, incorporating additional time series not used in previous NH compilations. Their result had a hockey stick shape although the MWP was clearly discernible. Crowley and Lowery (2000) concluded that the MWP was limited to a few short periods and the MWP was not as warm as 20th century temperatures. (In 2025 viewing in retrospect, it seems very likely the MWP was not as warm as today, but it might have been as warm as it was in year 2000).
McIntyre and McKitrick (2007) examined the results of Crowley and Lowery (2000) in some detail [1818McIntyre S, McKitrick R. The M&M Critique of the MBH98 Northern Hemisphere Climate Index: Update and Implications, Informal report. 2007. online at https://www.rossmckitrick.com/uploads/4/8/0/8/4808045/m_m.ee2005.pdf]. McIntyre prepared a new graph similar to the result of Crowley and Lowery except that it showed contributions from each of the 15 individual proxies with color-coding. McIntyre pointed out that the uptrend in the 20th century was due to four proxies, all of which were problematic with various defects. When he deleted these proxies, the MWP peak temperature was comparable to the 20th century peak temperature. (That would no longer be true in 2025 after 25 additional years of warming).
Hegerl, et al. (2007) added to the work of Crowley and Lowery (2000) using “updated records, a modified reconstruction method, and a new calibration technique” [4141Hegerl GC, Crowley TJ, Allen M, Hyde WT, Pollack HN, Smerdon JS, Zorita E. Detection of human influence on a new, validated 1500-year temperature reconstruction. J Climate. 2007;20(5):650–66. https://doi.org/10.1175/JCLI4011.1.]. The stated goal of the study (as evidenced by the title of the paper: “Detection of Human Influence on a New, Validated 1500-Year Temperature Reconstruction”) was to show the effect of CO2 on climate. As is usual in such studies, they did not show the actual comparisons between proxies and temperatures during the calibration period so there is little basis to judge their adequacy. Hegerl, et al. [4141Hegerl GC, Crowley TJ, Allen M, Hyde WT, Pollack HN, Smerdon JS, Zorita E. Detection of human influence on a new, validated 1500-year temperature reconstruction. J Climate. 2007;20(5):650–66. https://doi.org/10.1175/JCLI4011.1.] arrived at a slightly modified hockey stick result. Their hockey stick had a very minor MWP and a ~0.5 °C LIA. It is difficult to imagine how 12 or 7 or 5 proxy records, each of dubious credibility, centered in Europe, and with no representation from the Southern Hemisphere or the 70% of the Earth covered by oceans, could adequately define the global climate over 1,500 years?
What is missing from the proxy analysis of Hegerl, et al. [4141Hegerl GC, Crowley TJ, Allen M, Hyde WT, Pollack HN, Smerdon JS, Zorita E. Detection of human influence on a new, validated 1500-year temperature reconstruction. J Climate. 2007;20(5):650–66. https://doi.org/10.1175/JCLI4011.1.] (as well as most published proxy analysis) is a presentation of the comparison of each proxy at each location with the temperature as measured at that location during the calibration period (as well as after the calibration period). The variations from proxy to proxy are great. If these proxies properly represent temperature at each location, and the temperature patterns vary by that much, we might ask how many proxies (locations) are needed to approximate a global average temperature? Use of only 15 proxies appears on the face of it to be grossly inadequate.
Mann, et al. (2008) did finally show some evidence for a Medieval Warm Period and a Little Ice Age, but this publication continued to use the “trick” of substituting measured temperature for modeled temperature in recent years [55Mann ME, Zhang Z, Hughes MK, Bradley RS, Miller SK, Rutherford S, Ni F. Proxy-based reconstructions of hemispheric and global surface temperature variations over the past two millennia. Proc Natl Acad Sci U S A. 2008 Sep 9;105(36):13252-7. doi: 10.1073/pnas.0805721105. Epub 2008 Sep 2. PMID: 18765811; PMCID: PMC2527990.].
Reviews by McKitrick and McIntyre
The MBH study provided an inspiration for other groups invested in using proxies to estimate the past climate. As we have shown, several groups of climate scientists at diverse locations published papers using this technique, and apparently all were unaware of the errors inherent in the procedures used by MBH. These errors would never have been identified, and the results of all these faulty studies would have been accepted probably forever, had it not been for two Canadian experts in statistics who (for reasons unknown – although one might suspect they were politically conservative while Mann was obviously liberal) took it upon themselves to review this work by plunging into the finest details. Their original reviews: McKitrick (2005) and McIntyre and McKitrick (2005, 2006, 2007) provided strong evidence for faults in the MBH process [1313Ross M. What is the ‘Hockey Stick’ Debate About?, 2005. online at https://www.rossmckitrick.com/uploads/4/8/0/8/4808045/mckitrick-hockeystick.pdf-1818McIntyre S, McKitrick R. The M&M Critique of the MBH98 Northern Hemisphere Climate Index: Update and Implications, Informal report. 2007. online at https://www.rossmckitrick.com/uploads/4/8/0/8/4808045/m_m.ee2005.pdf]. It was difficult to get these papers through the highly selective editors of journals. Only McIntyre and McKitrick [1313Ross M. What is the ‘Hockey Stick’ Debate About?, 2005. online at https://www.rossmckitrick.com/uploads/4/8/0/8/4808045/mckitrick-hockeystick.pdf] was able to slip through into a major journal. Other studies were posted on the Internet or published in lesser journals. After this initial round of studies, McIntyre continued further review and analysis for many years on his website climateaudit.org down to the present day.
Hesitating to make data available: Sensing that McIntyre and McKitrick (M&M) were antithetical to the hockey stick results, the various climate scientists working on reconstruction of millennial temperatures resisted providing M&M with their data. Apparently, they were cautious in justifying their findings and did not cooperate in allowing their work to be checked. When M&M utilized the Freedom of Information Act (FOIA) to obtain data generated by government-funded work in the U.S. and England, the authors of papers sought help from politicians to circumvent the FOIA on specious grounds. M&M provide extensive detail on their struggles to obtain data. As the “climategate” tapes revealed, Phil Jones said: “We have 25 or so years invested in the work. Why should I make the data available to you, when your aim is to try and find something wrong with it?” [4242Mosher S, Fuller TW. Climategate: The CRUTape letters. Self-published; 2010.].
After much effort, M&M managed to obtain MBH data and details of their procedure. They uncovered several errors in the MBH approach.
Choosing the wrong mean: The data for each proxy is a series of estimated temperatures for each year over the entire timescale of the study (typically 1,000 to 2,000 years). These are derived from the proxy data using the algorithm developed during the calibration period (typically 100-150 years) when the proxy data is compared to estimated NH or global temperatures. In a typical statistical analysis, the data for any temperature series are “standardized” by converting original data to deviations from the mean. This is accomplished by first finding the mean of all the data, then subtracting the mean from each data point, so each point is now measured as a deviation from the mean, and scaling by dividing by the standard deviation of the entire data set. This re-centers and re-scales all the data to a mean of 0 and measures deviations from the mean in units of the standard deviation. As a trivial example, suppose one has data 17, 18, 14, … and the mean is 16, and the standard deviation is 2, then centering involves first subtracting the mean (16) from the data to get 1, 2, -2, … and then scaling by dividing by (2) to get ½, 1 and -1, ...
In the MBH program, a scaling was applied, but rather than subtract the mean of the entire data set over all 1,000 to 2,000 years, they subtracted the mean of the 20th-century portion (about 100 years) used for calibration, and then divided by the standard error of the 20th-century portion. While this may appear innocuous at first glance, it has crucial consequences for the results derived from this procedure.
For the many proxy temperature series that show essentially no trend across all years, the mean during the calibration period is about equal to the mean across all years, so it does not matter. The centered and scaled values are all small because deviations from the mean tend to be small.
For the few proxy temperature series that show a significant increase during the calibration period, use of the mean for the calibration period results in a mean that is much higher than the mean for the entire data period, so all the data points prior to the calibration period have high (negative) deviations. The statistical analysis does not treat all proxy temperature series equally. It does not simply add up all the proxies and average them. It weights individual data series by their deviations from the mean. Thus, the statistical method disproportionately emphasizes certain proxy series with uptrends in the 20th century. The MBH algorithm did just this. The statistical analysis would, in effect, sift through a data set and identify proxy series with a 20th-century up-trend, and then load almost all the weight onto these series. In effect it data-mines for hockey stick trends in a few series.
As it turns out, of 1,082 proxies used by MBH, only a handful show an increase in the 20th century, and all of these are tree ring proxies that probably suffer from the potential CO2 fertilization problem in the 20th century.
The effect of differing basis for centering is shown in Figure 7.
4343Wegman EJ, Scott DW, Said YH. Ad Hoc Committee Report on the hockey stick global climate reconstruction. Washington (DC): The Congressional Committee on Energy and Commerce; 2006 Jul 14. online at https://climateaudit.org/wp-content/uploads/2007/11/07142006_wegman_report.pdf]." /> Figure 7: Comparison of rework of the North American tree network first principal component (PC1) using MBH centering on the calibration period vs. using centering across the entire time span of the data set. The hockey stick is shown to be an artifice of the procedure. Adapted from Wegman, Scott, and Said [4343Wegman EJ, Scott DW, Said YH. Ad Hoc Committee Report on the hockey stick global climate reconstruction. Washington (DC): The Congressional Committee on Energy and Commerce; 2006 Jul 14. online at https://climateaudit.org/wp-content/uploads/2007/11/07142006_wegman_report.pdf].
To test the MBH data-mining algorithm, M&M ran an experiment in which they input only trendless random red noise, simulating the data one would obtain from trees in a climate that is only subject to random fluctuations with no warming trend. In 10,000 repetitions, they found that a conventional Principal Components (PC) algorithm (using the mean for the entire data set) almost never yielded a hockey stick–shaped PC1 (PC1 is the first principal component), but the MBH algorithm using the mean for only the calibration period yielded a pronounced hockey stick–shaped PC1 more than 99% of the time. The MBH algorithm efficiently looks for those kinds of series and flags them for maximum weighting. It concludes that a hockey stick is the dominant pattern even when pure noise is the input!
M&M extended their study by showing that the MBH data-mining procedure did not just pull out a random group of proxies—it pulled out an eccentric group of bristlecone pine chronologies that are problematic. So, M&M examined the consequences to the MBH results if these 20 bristlecone pine proxies were excluded. The result showed no hockey stick at all.
McIntyre continued further analysis and criticism of the procedure and dataset used by the various millennial climatologists on his blog climateaudit.org, which apparently were widely ignored by the climatologists.
Despite the detailed and provocative criticisms of the MBH procedure by M&M, neither Mann nor other members of the paleoclimatic community referred to these criticisms. It was like the Wizard of Oz saying: “pay no attention to the man behind the screen”. M&M were regarded as amateur interlopers who were neither climate scientists nor members of the club, so they seem to have been summarily ignored.
Esper, Cook, and Schweingruber [1212
Esper J, Cook ER, Schweingruber FH. Low-frequency signals in long tree-ring chronologies for reconstructing past temperature variability. Science. 2002 Mar 22;295(5563):2250-3. doi: 10.1126/science.1066208. PMID: 11910106.] (ECS) started out by repeating the theme of the paleoclimatic community:
“... the MBH reconstruction indicates that the 20th century warming is abrupt and truly exceptional. It shows an almost linear temperature decrease from the year 1000 to the late 19th century, followed by a dramatic and unprecedented temperature increase to the present time. The magnitude of warmth indicated in the MBH reconstruction for the MWP, 1000–1300 is uniformly less than that for most of the 20th century” [4444Esper J, Cook ER, Schweingruber FH. Low-frequency signals in long tree-ring chronologies for reconstructing past temperature variability. Science. 2002 Mar 22;295(5563):2250-3. doi: 10.1126/science.1066208. PMID: 11910106.].
However, ECS admitted: “the MBH reconstruction has been criticized for its lack of a clear MWP.” It was admitted that critics doubt that tree-ring records can preserve long-term, multi-centennial temperature trends. ECS then went on to present a defense of tree-ring reconstructions using centuries-long ring width trends in 1,205 radial tree ring series from 14 high-elevation and middle to high-latitude sites distributed over a large part of the NH extra-tropics. While ECS intended to support Mann, Bradley, and Hughes [22Mann ME, Bradley RS, Hughes MK. Northern Hemisphere temperatures during the past millennium: Inferences, uncertainties, and limitations. Geophys Res Lett. 1999 Apr 1;26(6):759–62. https://doi.org/10.1029/1999GL900070.], the large differences between their results and those of MBH introduce skepticism. This raises concerns about the reliability of reconstructions based solely on proxies. Furthermore, the anomalies in the ECS data series are mostly negative, suggesting that the mean used for data processing was not chosen as the mean for the entire time period, but was chosen only for the calibration period.
Nevertheless, based on their result, ECS reached the following conclusions:
Multi-centennial temperature variability in long tree ring records can be preserved if the appropriate tree ring data and proper methods of analysis are used.
The MWP appears to be more temporally variable than the warming trend of the last century and may have begun in the early 900s.
The warmest period covers the interval 950–1045, with the peak occurring around 990.
Past comparisons of the MWP with the 20th-century warming back to the year 1000 may not have included all of the MWP and, perhaps, not even its warmest interval.
McIntyre (2007) examined the data in ECS in considerable detail and wrote at length on their analysis [4545McIntyre S. Climate Audit Website. 2007. online at http://www.climateaudit.org]. The issues are intricate and detailed and beyond the scope of the present write-up. McIntyre commented on the difficulty in obtaining the original data: “It’s obviously been pulling teeth to get data from Esper. After only two years of trying, I’ve recently obtained all but one site chronology ... and gobbledy-gook about methodology.” Using the 13 site chronologies that he had available, McIntyre plotted the individual proxies as shown in Figure 8. This is sometimes referred to as a “spaghetti chart”.
4545McIntyre S. Climate Audit Website. 2007. online at http://www.climateaudit.org]." /> Figure 8: “Spaghetti chart” of individual proxies (except Mongolia). Adapted from McIntyre [4545McIntyre S. Climate Audit Website. 2007. online at http://www.climateaudit.org].
McIntyre pointed out that only 2 of the 13 series have strongly elevated closing values. They both entail foxtail pines (interbreeding cousins of bristlecone pines) both from sites very close to Sheep Mountain, California. He cast considerable doubt on the validity of these two proxy sites. McIntyre then went on to present individual plots for each proxy, and perform a simple average. These results show that the proxies vary widely, and cast doubt on the consistency and credibility of the various proxies. While ECS provides us with assurance that “multi-centennial temperature variability in long tree-ring records can be preserved if the appropriate tree-ring data and proper methods of analysis are used,” Figure 8 suggests otherwise.
McIntyre (2007) presented a simple average of all the proxies as shown in Figure 9. The result suggests an MWP and an LIA. Nevertheless, it seems evident that ECS used statistical methods that potentially introduced weighting bias of the two suspect proxies with high closing values.
4444Esper J, Cook ER, Schweingruber FH. Low-frequency signals in long tree-ring chronologies for reconstructing past temperature variability. Science. 2002 Mar 22;295(5563):2250-3. doi: 10.1126/science.1066208. PMID: 11910106.]. Adapted from McIntyre [4545McIntyre S. Climate Audit Website. 2007. online at http://www.climateaudit.org]." /> Figure 9: Simple average of proxy data from Esper, Cook, and Schweingruber [4444Esper J, Cook ER, Schweingruber FH. Low-frequency signals in long tree-ring chronologies for reconstructing past temperature variability. Science. 2002 Mar 22;295(5563):2250-3. doi: 10.1126/science.1066208. PMID: 11910106.]. Adapted from McIntyre [4545McIntyre S. Climate Audit Website. 2007. online at http://www.climateaudit.org].
Some paleoclimatic scientists argued that the MBH procedure is supported by other, more recent studies that also lead to a hockey stick. However, amazingly enough, none of these further studies seemed to refer to the M&M criticisms of the MBH procedure, and they used the mean of only the calibration period, making the same mistake as MBH, over and over again. Proof of this assertion is the fact that in all of these reconstructions, the temperature anomaly remains starkly negative at all times prior to the calibration period. Montford (2010) supplied Figure 10 attributed to M&M [4646Montford AW. The Hockey Stick Illusion: Climategate and the Corruption of Science, Stacey International, London, UK. 2010.]. The lower graph is the result of MBH98 while the upper graph is a simple average of their proxies.
4646Montford AW. The Hockey Stick Illusion: Climategate and the Corruption of Science, Stacey International, London, UK. 2010.]." /> Figure 10: Temperature anomalies from MBH. The lower graph is the result of MBH98 while the upper graph is a simple average of their proxies [4646Montford AW. The Hockey Stick Illusion: Climategate and the Corruption of Science, Stacey International, London, UK. 2010.].
Hide the decline: Tree ring proxies are important in attempting to discern historical temperatures over the past two millennia because they are readily available, and sometimes date back 2,000 years or more. Hence, tree ring proxies are prominent in the MBH and other related reconstructions of global temperatures over one or two millennia. However, tree growth is also affected by other factors (water availability, humidity, wind, cloudiness, CO2 content in the atmosphere, nutrients, etc.) that add noise to the temperature signal. Hence, it is not a simple matter to extract accurate historical temperature data from tree rings (or other proxies, for that matter). It seems likely that climatologists had a vested interest in proving that rising temperatures in the 20th century are unique and unprecedented, indicating that natural causes cannot account for this change, and it must be attributed to growth of greenhouse gas concentrations. We can speculate on their motives. One might be a true idealistic desire to save the world from what they believed is an impending catastrophe due to global warming. Another might be the crass fact that funding for climate research will be proportional to the degree of catastrophe that is predicted. Whatever their motives, unfortunately, the behavior of tree ring proxies was problematic. Tree ring proxies showed aberrations at various times, but the most serious problem was that some important tree ring data typically show a downward trend in the late 20th century while measured global temperatures were rising. Since tree rings as a measure of temperature were calibrated across the 20th century, tree ring properties should mirror temperature during the entire calibration period. Since the tree rings diverged sharply from temperature toward the end of the calibration period, the researchers truncated the calibration phase later in the 20th century to (1) hide innate faults in the tree ring proxies, and (2) preserve the appearance of the desired hockey stick. This approach has been criticized for lacking scientific transparency and based on a suggestion by one of the climatologists, as revealed in “climategate” it was referred to as “hide the decline” [4242Mosher S, Fuller TW. Climategate: The CRUTape letters. Self-published; 2010.,4646Montford AW. The Hockey Stick Illusion: Climategate and the Corruption of Science, Stacey International, London, UK. 2010.].
The apparent goal was to preserve the hockey stick, which was felt to be necessary to show that rising greenhouse gases in the 20th century was the unique cause of continuously rising temperatures. The “solution” to the problem of this “divergence” [of tree ring data from reality] was “the trick” (as stated by one of the climatologists) of not showing the down trending proxy data in the late 20th century, and replacing it with measured temperatures that were rising. A hacked email by Phil Jones said:
“I’ve just completed Mike’s Nature trick [Michel Mann’s publication in Nature where he replaced tree ring proxy data with actual data because the tree ring data went in the ‘wrong’ direction] of adding the real temperatures to each series for the last 20 years (i.e. from 1981 onwards) and from 1961 for Keith’s to hide the decline” [4242Mosher S, Fuller TW. Climategate: The CRUTape letters. Self-published; 2010.].
It is particularly revealing to observe some results of Briffa, et al. [4747Briffa KR, Osborn TJ, Schweingruber FH, Harris IC, Jones PD, Shiyatov SG, Vaganov EA. Low-frequency temperature variations from a northern tree-ring-density network. J Geophys Res. 2001;106(D3):2929–41. https://doi.org/10.1029/2000JD900617.]. Figure 11 shows eight different reconstructions using various procedures with one preferred reconstruction. Note that all reconstructions decline in the second half of the 20th century while measured temperatures rise. Briffa, et al.
4747Briffa KR, Osborn TJ, Schweingruber FH, Harris IC, Jones PD, Shiyatov SG, Vaganov EA. Low-frequency temperature variations from a northern tree-ring-density network. J Geophys Res. 2001;106(D3):2929–41. https://doi.org/10.1029/2000JD900617.]." /> Figure 11: Eight reconstructions of historical northern non-tropical summer temperatures using various procedures. The heavy line (Briffa-01) is “preferred” [4747Briffa KR, Osborn TJ, Schweingruber FH, Harris IC, Jones PD, Shiyatov SG, Vaganov EA. Low-frequency temperature variations from a northern tree-ring-density network. J Geophys Res. 2001;106(D3):2929–41. https://doi.org/10.1029/2000JD900617.].
[4747Briffa KR, Osborn TJ, Schweingruber FH, Harris IC, Jones PD, Shiyatov SG, Vaganov EA. Low-frequency temperature variations from a northern tree-ring-density network. J Geophys Res. 2001;106(D3):2929–41. https://doi.org/10.1029/2000JD900617.] also compared their results with reconstructions by others as shown in Figure 12. The divergence is readily seen and Jones’ “trick” produces the hockey stick.
11Mann ME, Bradley RS, Hughes MK. Global-scale temperature patterns and climate forcing over the past six centuries. Nature. 1998 Apr 23;392(6678):779–87. https://doi.org/10.1038/33859.]. BO-99 = Briffa and Osborne (1999). J-98 = Jones, et al. (1998). CL-00 = Crowley and Lowery [2121Crowley TJ, Lowery TS. How warm was the Medieval Warm Period? Ambio. 2000;29(1):51–4. https://doi.org/10.1579/0044-7447-29.1.51.]. B-01 = Briffa, et al. [4747Briffa KR, Osborn TJ, Schweingruber FH, Harris IC, Jones PD, Shiyatov SG, Vaganov EA. Low-frequency temperature variations from a northern tree-ring-density network. J Geophys Res. 2001;106(D3):2929–41. https://doi.org/10.1029/2000JD900617.]." /> Figure 12: Comparison of reconstructions. M-98-99 = Mann, et al. [11Mann ME, Bradley RS, Hughes MK. Global-scale temperature patterns and climate forcing over the past six centuries. Nature. 1998 Apr 23;392(6678):779–87. https://doi.org/10.1038/33859.]. BO-99 = Briffa and Osborne (1999). J-98 = Jones, et al. (1998). CL-00 = Crowley and Lowery [2121Crowley TJ, Lowery TS. How warm was the Medieval Warm Period? Ambio. 2000;29(1):51–4. https://doi.org/10.1579/0044-7447-29.1.51.]. B-01 = Briffa, et al. [4747Briffa KR, Osborn TJ, Schweingruber FH, Harris IC, Jones PD, Shiyatov SG, Vaganov EA. Low-frequency temperature variations from a northern tree-ring-density network. J Geophys Res. 2001;106(D3):2929–41. https://doi.org/10.1029/2000JD900617.].
Hegerl, et al. also used Jones’ “trick” of tacking on the recent instrumental record to the proxy results [4141Hegerl GC, Crowley TJ, Allen M, Hyde WT, Pollack HN, Smerdon JS, Zorita E. Detection of human influence on a new, validated 1500-year temperature reconstruction. J Climate. 2007;20(5):650–66. https://doi.org/10.1175/JCLI4011.1.]. Mann, Bradley, and Hughes [11Mann ME, Bradley RS, Hughes MK. Global-scale temperature patterns and climate forcing over the past six centuries. Nature. 1998 Apr 23;392(6678):779–87. https://doi.org/10.1038/33859.] and Mann, Bradley, and Hughes [22Mann ME, Bradley RS, Hughes MK. Northern Hemisphere temperatures during the past millennium: Inferences, uncertainties, and limitations. Geophys Res Lett. 1999 Apr 1;26(6):759–62. https://doi.org/10.1029/1999GL900070.] also cleverly substituted the measured temperatures for the modeled temperatures (Jones’ “trick”) to exaggerate the rise in the 20th century and thus accentuate the hockey stick.
One important test for reliability of proxies is how well they track temperatures during the calibration period. Of all the many papers on proxies that I have reviewed, very few if any have provided such data in any detail. Briffa, et al. is an exception [4848Briffa KR, Schweingruber FH, Jones PD, Osborn TJ, Shiyatov SG, Vaganov EA. Reduced sensitivity of recent tree-growth to temperature at high northern latitudes. Nature. 1998;391(6668):678–82. https://doi.org/10.1038/35596.]. They compared tree ring proxies with temperatures at many sites in the NH from 1880 to 1990. They said:
“When averaged over large areas of northern America and Eurasia, tree-ring density series display a strong coherence with summer temperature measurements averaged over the same areas, demonstrating the ability of this proxy to portray mean temperature changes over sub-continents and even the whole Northern Hemisphere. During the second half of the twentieth century, the decadal-scale trends in wood density and summer temperatures have increasingly diverged as wood density has progressively fallen. The cause of this increasing insensitivity of wood density to temperature changes is not known ...”
Although Briffa, et al. [4848Briffa KR, Schweingruber FH, Jones PD, Osborn TJ, Shiyatov SG, Vaganov EA. Reduced sensitivity of recent tree-growth to temperature at high northern latitudes. Nature. 1998;391(6668):678–82. https://doi.org/10.1038/35596.] pointed out the discrepancy between tree ring data and temperature after 1950, their assessment that proxies tracked temperatures prior to 1950 was still optimistic.
McIntyre1 analyzed the data from several hockey stick reports (e.g. Briffa and Osborn, 1999). This is known as the “hide the decline” syndrome. Figure 13 shows the tree ring proxy (combination of green and blue curves). However, when Briffa and Osborn were confronted with late 20th century tree ring data indicating a sharp drop in temperature, they omitted the more recent data, raising concerns about transparency (blue curve) from their paper and ended the tree ring data with the green curve. They then replaced the more recent tree ring data by the measured curve (red curve).
Figure 13: “Trick” of replacing tree ring proxy by measured temperature (McIntyre, http://climateaudit.org/2011/03/17/hide-the-decline-sciencemag/#more-13285).
Since the publication of this data in 1998, a number of additional papers were published dealing in one way or another with tree ring proxies.
For example, Jacoby, et al. [4949Jacoby GC, Lovelius NV, Shumilov OI, Raspopov OM, Karbainov JM, Frank DC. Long-term temperature trends and tree growth in the Taymir region of northern Siberia. Quat Res. 2000;53(3):312–8. https://doi.org/10.1006/qres.2000.2130.] said:
“Data from annual tree-ring widths are used to reconstruct May–September mean temperatures for the past four centuries. These warm-season temperatures correlate with annual temperatures and indicate unusual warming in the 20th century. However, there is a loss of thermal response in ring widths since about 1970” [4949Jacoby GC, Lovelius NV, Shumilov OI, Raspopov OM, Karbainov JM, Frank DC. Long-term temperature trends and tree growth in the Taymir region of northern Siberia. Quat Res. 2000;53(3):312–8. https://doi.org/10.1006/qres.2000.2130.].
Thus, they admit to a divergence problem after 1970. However, when one examines their data prior to 1970, the correlation of tree ring data with temperature even prior to 1970 is not convincing. D'Arrigo, et al. came to the defense of tree ring proxies [5050D'Arrigo R, Wilson R, Jacoby G. Further discussion on: Tree-ring temperature reconstructions for the past millennium. 2006. https://www.ldeo.columbia.edu/res/fac/trl/downloads/Publications/D%27AWilsJac.nrc.followup.pdf]. They began their paper with the usual pledge that “recent warming in the Northern Hemisphere appears to have been unprecedented over the past millennium and that this warming is most likely a result of the anthropogenic release of greenhouse gases into the atmosphere” – which has not much to do with the reliability of tree ring proxies. They mention that D'Arrigo, et al. used “simple averaging of tree-ring records (after accounting for differences in mean and variance over time), followed by linear regression” [5151D'Arrigo R, Wilson R, Jacoby G. On the long-term context for late twentieth century warming. J Geophys Res Atmos. 2006;111(D03103) https://doi.org/10.1029/2005JD006352.]. Simple averaging is a step in the right direction, but how good are the proxies as temperature indicators? As is usual in almost all papers on proxies, the data for the calibration period were not shown. They did allude to the divergence between tree ring proxies and temperature reported by Briffa, et al. [4848Briffa KR, Schweingruber FH, Jones PD, Osborn TJ, Shiyatov SG, Vaganov EA. Reduced sensitivity of recent tree-growth to temperature at high northern latitudes. Nature. 1998;391(6668):678–82. https://doi.org/10.1038/35596.] and others cited in their paper, when they said:
“Theories for the cause (s) of this observed divergence, which may vary from site to site, include decreased temperature sensitivity due to warmer temperatures, drought stress, increased winter snowmelt and ozone effects. This divergence needs to be considered to avoid bias in dendroclimatic reconstructions; however, it is not present everywhere. For example, temperature-sensitive elevational treeline sites in Mongolia and the European Alps exhibit dramatic growth increases in recent decades. Greater attention to site selection (e.g. avoidance of drought-prone sites) and careful comparison of adjacent sites with regards to their ecological characteristics can help circumvent this problem. [It has been] demonstrated that the divergence appears to be limited to the recent period (after ~1950) and to trees from some northern locations (at some sites within ~55-70°N), and that there is no evidence for a comparable divergence prior to this time (e.g. during the Medieval Warm Period). These observations suggest a unique, anthropogenic cause for the recent divergence and argue very strongly that tree-ring temperature reconstructions for the past millennium should not be called into question based on these recent observations” [4848Briffa KR, Schweingruber FH, Jones PD, Osborn TJ, Shiyatov SG, Vaganov EA. Reduced sensitivity of recent tree-growth to temperature at high northern latitudes. Nature. 1998;391(6668):678–82. https://doi.org/10.1038/35596.].
One problem with site selection is that if one is attempting to estimate a global average temperature, one needs all the sites one can find. If only a few sites provide reliable data, how can one derive global or even hemispheric temperatures in the past? The claim that “there is no evidence for a comparable divergence prior to this time (e.g. during the Medieval Warm Period)” doesn’t make sense because there are no measured temperature data for that period and hence there is no way to ascertain whether such a divergence exists.
To hide the divergence between proxies and reality, MBH terminated their calibration phase in 1980 even though more recent data were available. (Unfortunately, the proxies went down while measured temperatures went up after 1980.)
Wilmking and Singh (2008) discussed the “divergence effect” between measured temperatures and tree ring proxies in the 2nd half of the 20th century and pointed out that this “seriously questions the validity of tree-ring based climate reconstructions, since it seems to violate the assumption of a stable response of trees to changing climate over time” [5252Wilmking M, Singh J. Eliminating the “divergence problem” at Alaska’s northern treeline. Clim Past Discuss. 2008;4:741–759. https://doi.org/10.5194/cpd-4-741-2008.]. In their study they claimed to have
“... eliminated the ‘divergence effect’ in northern Alaska by careful selection of individual trees with consistently significant positive relationships with climate (17% of sample) and successfully attempted a divergence-free climate reconstruction using this subset”.
However, they did admit:
“The majority of trees (83%) did not adhere to the uniformitarian principle as usually applied in dendroclimatology. Our results thus support the notion that factors acting on an individual tree basis are the primary causes for the ‘divergence effect’ (at least in northern Alaska)”.
Unfortunately, even the small subset of 17% of trees that are claimed to show good consistency with temperatures over the last century provide somewhat doubtful consistency. The diagram provided by Wilmking and Singh (2008) in their Figure 2 is a tiny little diagram that compresses the excursions between the temperature and tree ring curves. Nevertheless, accepting the claim that 17% of the trees show good correlation with temperature for the sake of argument, the question arises as to whether it makes sense to select a subset of trees that happen to fit the temperature curve, and use these for estimating temperatures a thousand years or more ago. Apparently Wilmking and Singh suggested that there occurs a “mixture of trees with stable and non-stable climate growth relationships” and the ones with stable relationships provide a basis for estimating past climates. However, it may be equally likely that all the tree ring records are randomized by other variables than temperature, and by happenstance, about 17% of the records happen to have correlation coefficients with temperature that satisfy the criterion adopted by Wilmking and Singh. There is then no great reason to believe that even these 17% of trees would remain as accurate temperature indicators over much longer periods.
Sparse data set: Aside from all the other problems in reconstruction of millennial temperatures, the data set from which the analyses were conducted was very sparse. When MBH09 extended the time scale of MBH98 back from year 1400 to 1000, they depended on just 12 local proxy series (Table 2). Four were ice cores from a single small ice cap in Peru, and three were derived from southwestern U.S. tree rings. How could one possibly claim to have estimated global or even NH temperatures from such a sparse data set?
Table 2: Number of proxies vs. earliest date according to Mann, Bradley, and Hughes [11Mann ME, Bradley RS, Hughes MK. Global-scale temperature patterns and climate forcing over the past six centuries. Nature. 1998 Apr 23;392(6678):779–87. https://doi.org/10.1038/33859.].
Lack of uniqueness: Burger and Cubasch is a difficult paper to read. It is full of jargon and uses a number of acronyms that are not defined [5353Burger G, Cubasch U. Are multiproxy climate reconstructions robust? Geophys Res Lett. 2005;32(L23711). https://doi.org/10.1029/2005GL024155.]. It is likely that only a reader who is intimately connected to statistical processing of long-term historical climate data could follow this paper in detail. Nevertheless, it appears to be an important paper and must be considered here. Burger and Cubasch [5353Burger G, Cubasch U. Are multiproxy climate reconstructions robust? Geophys Res Lett. 2005;32(L23711). https://doi.org/10.1029/2005GL024155.] examined the mathematical procedure used by MBH for the NH temperature reconstruction and noted that there were six key junctures where a fork in the road occurred, and MBH had to choose one or the other pathway for the ensuing computations. Since any one choice of path at one juncture could be combined with any other choice of path at another juncture, and there are six junctures, there must be a total of 26 = 64 possible pathways to carry out the entire calculation.
We will not describe all of the junctures and choices here, but it is important to mention that one of the junctures was the choice of alternatives: (1) the MBH calculation of temperature anomalies based on the mean over the calibration period vs. (2) calculation of the mean for the entire time span of the data. As M&M showed, use of only the calibration period mines for hockey stick results.
The various pathways can be described by means of six-digit binary numbers. The MBH method is described by one of these 64 binary numbers. Burger and Cubasch said: “No a priori, purely theoretical argument allows us to select one out of the 64 as being the ‘true’ reconstruction” [5353Burger G, Cubasch U. Are multiproxy climate reconstructions robust? Geophys Res Lett. 2005;32(L23711). https://doi.org/10.1029/2005GL024155.]. Burger and Cubasch also argued that the alternate paths at each juncture are “a priori sound, with numerous applications elsewhere, and can hardly be dismissed purely on theoretical grounds.” However, in regard to the juncture where one chooses the mean as a basis for calculating anomalies, use of the mean for only the 20th century is fundamentally wrong a priori, and therefore the assertion by Burger and Cubasch [5353Burger G, Cubasch U. Are multiproxy climate reconstructions robust? Geophys Res Lett. 2005;32(L23711). https://doi.org/10.1029/2005GL024155.] is incorrect in this specific instance. The choice of the time period for the mean is not one of reasonable alternatives, but rather a choice of right vs. wrong.
The results of Burger and Cubasch [5353Burger G, Cubasch U. Are multiproxy climate reconstructions robust? Geophys Res Lett. 2005;32(L23711). https://doi.org/10.1029/2005GL024155.] are shown in Figure 14. Unfortunately, there is no key given to identify which of the 64 pathways correspond to the various temperature reconstructions. A worrisome feature is that the zero line appears to be the mean of the 20th century data and most anomalies are negative. This leads one to wonder whether they actually did calculations with the mean for the whole time period, and if they did, why are the anomalies (for non-MBH options) not centered vertically on the zero line? Burger and Cubasch [5353Burger G, Cubasch U. Are multiproxy climate reconstructions robust? Geophys Res Lett. 2005;32(L23711). https://doi.org/10.1029/2005GL024155.] concluded:
5353Burger G, Cubasch U. Are multiproxy climate reconstructions robust? Geophys Res Lett. 2005;32(L23711). https://doi.org/10.1029/2005GL024155.]." /> Figure 14: Temperature reconstructions. Adapted from Burger and Cubasch [5353Burger G, Cubasch U. Are multiproxy climate reconstructions robust? Geophys Res Lett. 2005;32(L23711). https://doi.org/10.1029/2005GL024155.].
“Any robust, regression-based method of deriving past climatic variations from proxies is therefore inherently trapped by variations seen at the training stage, that is, in the instrumental period. The more one leaves that scale and the farther the estimated regression laws are extrapolated the less robust the method is. The described error growth is particularly critical for parameter-intensive, multi-proxy climate field reconstructions of the MBH type. Here, for example, co-linearity and over-fitting induce considerable error already in the estimation phase.”
It appears that almost any result can follow from an integration of proxies, and no proxy result can be trusted.
Other criticisms: Zorita and von Storch (2005) examined methods used to construct historical temperatures [5454Zorita, Eduardo; and Hans von Storch (2005), “Methodical aspects of reconstructing non-local historical temperatures,” Memorie della Societa` Astronomica Italiana 76, 794–801. (No DOI)]. It is apparent that Zorita and von Storch (2005) found significant problems with the methods used by MBH to infer long-term historical temperature records. Zorita and von Storch (2005) started with a model that the authors developed for a 1,000-year record of global temperatures called ECHO-G. The methods used by MBH were tested by following the MBH procedure, in which all data were considered to be deviations from the 1900–1980 mean value, even though this period is not representative of the temperature history of the past millennium. They followed the procedure of MBH but utilized different levels of noise as inputs. Inevitably, the methods of MBH led to a so-called hockey stick type of figure and underestimated the variability of temperature in the past. Mann, et al. (2007) argued against the results of Zorita and von Storch (2005), and Zorita, et al. (2007) rebutted this criticism [5555Zorita E, von Storch H. Methodical aspects of reconstructing non-local historical temperatures. Mem Soc Astron Ital. 2005;76:794–801. https://doi.org/10.1175/JCLI4171.1.].
Esper, et al. (2005a,b) concluded:
“Our understanding of the shape of long-term fluctuations is better than commonly perceived, but the absolute amplitude of temperature variations is poorly understood ... Overall, amplitude discrepancies are of the order of the total variability estimated over the past millennium ...” [2929Esper J, Frank DC, Timonen M, Zorita E, Wilson RJS, Luterbacher J, Holzkämper S, Fischer N, Wagner S, Nievergelt D, Verstege A, Büntgen U. Orbital forcing of tree-ring data. Nat Clim Chang. 2012 Jul 8. 10.1038/nclimate1589.,3030Esper J, Büntgen U, Timonen M, Frank DC. Variability and extremes of northern Scandinavian summer temperatures over the past two millennia. Glob Planet Change. 2012;88–89:1–9. https://doi.org/10.1016/j.gloplacha.2012.01.006.].
Even this conclusion seems optimistic.
Typically, when a set of proxies from various regions is compared, the differences between proxies are large compared to the similarities. The proxies used by Mann, et al. (2008) were no exception [55Mann ME, Zhang Z, Hughes MK, Bradley RS, Miller SK, Rutherford S, Ni F. Proxy-based reconstructions of hemispheric and global surface temperature variations over the past two millennia. Proc Natl Acad Sci U S A. 2008 Sep 9;105(36):13252-7. doi: 10.1073/pnas.0805721105. Epub 2008 Sep 2. PMID: 18765811; PMCID: PMC2527990.]. Figure 5 shows some of the proxies that they utilized. Evidently, the variations from proxy to proxy outweigh any consistent signal that may underlie these time series. Hence this set of time series represents a dataset with low signal-to-noise ratio. Nevertheless, Mann, et al. (2008) remained undaunted. They applied a variety of sophisticated statistical methods in an attempt to unravel a signal from the noise. As shown in Figure 14, almost any desired result can be obtained from interpreting this very noisy data, depending on how it is processed.
In some of their results, Mann, et al. [55Mann ME, Zhang Z, Hughes MK, Bradley RS, Miller SK, Rutherford S, Ni F. Proxy-based reconstructions of hemispheric and global surface temperature variations over the past two millennia. Proc Natl Acad Sci U S A. 2008 Sep 9;105(36):13252-7. doi: 10.1073/pnas.0805721105. Epub 2008 Sep 2. PMID: 18765811; PMCID: PMC2527990.] provided estimates of the uncertainties in their results as a standard deviation envelope around the linear curve of temperature vs. time. In their Figure S11, they indicated that when alternate calibration periods are included, the total standard deviation of a temperature estimate for any year is typically about ±0.6 °C, which suggests that any variations smaller than 0.6 °C are uncertain by a significant amount. When an uncertainty of at least ±0.6 °C is imposed on the spread of estimates from various models, the resultant envelope would be large enough to hide a wide range of historical temperature profiles, depending on interpretation.
There seems to be an inverse relationship working here: the more proxies that are included, the lower is the signal-to-noise ratio in the product. As Mann and associates relentlessly added new proxies, the validity of results did not consistently improve with additional data.
It is noteworthy that Richard Muller said:2
“… that carbon dioxide from burning of fossil fuels will prove to be the greatest pollutant of human history. It is likely to have severe and detrimental effects on global climate. I would love to believe that the results of Mann, et al. are correct, and that the last few years have been the warmest in a millennium”.
Hence, he was far from being a confirmed skeptic. Nevertheless, he went on to roundly criticize the methods of Mann, et al. and concluded that the hockey stick is actually an “artifact of poor mathematics” and said: “A methodologically questionable hockey stick model is more dangerous than a broken one--if we know it is broken”.
It is also worthwhile to review the response of Nature magazine to McIntyre and McKitrick when they attempted to publish their critique of Mann, et al. (1998)3. On January 2004, M&M submitted their critique as a Letter to Nature. One Referee provided a favorable review. The other offered some confusion emphasizing the complexity of the details, but said: “In general terms I found the criticisms raised by McIntyre and McKitrick worth of being taken seriously. They have made an in-depth analysis of the MBH reconstructions and they have found several technical errors that are only partially addressed in the reply by Mann, et al.” Nature invited a revised submission to which M&M responded in March 2004 with a revised manuscript. Nature then asked M&M to reduce the manuscript to 800 words. This was difficult, but was achieved and reduced manuscript was submitted in April 2004. In August 2004, Nature declined to publish the article that now (for reasons unexplained) needed to be reduced to 500 words. The main reason given was that the matters involved were “too technical” for a science journal. In other words, in a matter concerning the legitimacy and validity of the most widely accepted model of the Earth’s climate over the past millennium, Nature opted not to publish the critique, citing complexity by Mann, et al. to stand unchallenged because the issues involved were too complicated. The ironic thing was that the paleoclimatic community could then claim that the criticisms of M&M could not be taken seriously because they were not published in a peer-reviewed journal. But the statistical debate around the choice of mean remains a central methodological concern. Surely, the journal reviewers could understand that?
The paleoclimatic community
The climategate emails reveal that climatologists who specialize in reconstructing paleoclimates over the past few millennia are in frequent communication with one another and are mutually supportive of their various efforts [4242Mosher S, Fuller TW. Climategate: The CRUTape letters. Self-published; 2010.,4646Montford AW. The Hockey Stick Illusion: Climategate and the Corruption of Science, Stacey International, London, UK. 2010.]. For several years, the various paleoclimatologists published their reconstructions and acted as reviewers for one another’s manuscripts submitted to journals. The hockey stick was widely accepted and became one of the pivotal supporting foundations of the belief that CO2 caused the warming since the 1800s. Then around 2005, McIntyre and McKitrick began reviewing these studies in detail and reported their analysis at the climateaudit.org website. They found that most publications were flawed due to (1) use of a mean for only the calibration period, (2) hiding the decline of tree ring proxies in the late 20th century and using Jones’ “trick” of substituting measured temperatures for proxies, as well as (3) various other statistical problems and proxy issues discussed on climateaudit.org. This threatened to undermine years of work upon which the paleoclimatologists’ reputations were based. Instead of admitting their errors and fixing them, they became defensive at first, and then went on the offense against their critics. One of the participants in an email cautioned regarding Mann saying: “he would probably go ballistic” regarding any criticism of his work.
Ball (2007) was critical of how Phil Jones (Head, Climate Research Group, East Anglia University) came up with his estimate of uncertainty in his temperature reconstructions and wrote to Jones asking for an explanation [5656Tim B. The Science Isn’t Settled: The Limitations of Global Climate Models, Marshall Institute. 2007. online at https://www.proquest.com/docview/204095371?sourcetype=Scholarly%20Journals]. Ball (2007) claimed that Jones replied in an email:
“We have 25 or so years invested in the work. Why should I make the data available to you, when your aim is to try and find something wrong with it?”
When a leading climatologist is more concerned with protecting his turf than finding truth, things have taken a very bad turn. Jones also said in an email to Michael E. Mann, professor of climatology, Penn State University:
“And don't leave stuff lying around on anonymous download sites - you never know who is trawling them. McIntyre and McKitrick have been after the Climatic Research Unit ... data for years. If they ever hear there is a Freedom of Information Act now in the United Kingdom, I think I'll delete the file rather than send it to anyone.”
These scientists would apparently rather destroy data than allow others to check up on them. In 2009, 2010 and 2011, extensive sets of emails between principal figures in the paleoclimatic community were made public after hacking. These emails suggested a deeply imbedded agreement amongst these climatologists to promulgate their orthodoxy that the Earth’s climate has hardly wavered over the past 2,000 years, and that CO2 was the principal cause of unprecedented global warming in the 20th century. The collection of emails is now referred to as “climategate”. As Mosher and Fuller (2010) claimed, they:
“... ruthlessly suppressed dissent by insuring that contrary papers were never published and that editors who didn’t follow their party line were forced out of their position. When Freedom of Information requests threatened to reveal their misbehavior, the emails showed them actively conspiring to delete emails to frustrate legitimate requests for information. Worst of all, one scientist threatened to delete climate data rather than turn it over, and that data is still missing” [4242Mosher S, Fuller TW. Climategate: The CRUTape letters. Self-published; 2010.].
The defensive posture of the paleoclimatic community seems to have been to disclose nothing, prevent others from delving into their work, totally ignore criticisms, and continue publishing their work ignoring criticisms, while acting as reviewers for one another’s manuscripts. Amazing at it seems, even to this day, I am not aware of any principal paleoclimatologist responding to or even admitting that a criticism was made of their use of the mean for only the calibration period.
Dr. Phil Jones, head of the Hadley Climate Research Unit (CRU) in 2009, said that the U. S. Department of Energy was funding his data collection – and that officials there agreed that he should not have to release the data. In a 2009 email, he said:
“Work on the land station data has been funded by the U. S. Dept of Energy, and I have their agreement that the data needn’t be passed on. I got this [agreement] in 2007.”
Two months later, Jones said that the data “… has to be well hidden. I’ve discussed this with the main funder (U.S. Dept of Energy) in the past and they are happy about not releasing the original station data.” Evidently, the U. S. Dept of Energy was in agreement with the paleoclimatic community to evade the requirements of the Freedom of Information Act as well as the basic tenets of science. It should be emphasized that this is not a case of intellectual property produced by some brilliant new concept. It merely represents collecting climate data and storing it in columns. If the U. S. Dept of Energy paid for it, it should be in the public domain.
The paleoclimatic community went on the offense. Since the principal figures in the paleoclimatic community were widely published, they tended to be chosen as reviewers for new manuscripts submitted to journals. They were able to act in concerns have been raised about selective peer-review practices from being accepted for publication and put pressure on editors who did not cooperate. The paleoclimatic community refereed one another’s papers submitted to journals, communicated in a mutual back-scratch environment subverting the peer review process, pressured journal editors not to publish papers contrary to the orthodoxy, cooperated to write rebuttals to any papers that did slip through their barrier to publication of contrary views, and frequently challenged alternative interpretations through coordinated responses.
A particularly egregious episode in the actions taken by members of the paleoclimatic research community is documented in exhaustive detail at the Bishop Hill website [5757Hill B. Commentary on the Hockey Stick. http://bishophill.squarespace.com/blog/2008/8/11/caspar-and-the-jesus-paper.html]. The 2007 IPCC Report was in its final stages before publication and the paleoclimatic community was responsible for one section of it. The challenge to the hockey stick by McIntyre in a paper that slipped through the editors and got published in the Geophysical Research Letters (GRL) needed to be rebutted in time for inclusion in the 2007 IPCC Report. Two members of the paleoclimatic community , Caspar Amman and Eugene Wahl were chosen to do this. However, their paper hurriedly put together, was rejected by GRL. Amman and Wahl were also working on a longer paper for submission to the journal Climate Change. Amazingly, McIntyre was chosen as one of the reviewers. He had shown that the key statistical figure of merit (R2) for the MBH analysis was close to zero, but Amman and Wahl did not mention that. The paleoclimatic community needed both Amman and Wahl papers to get published so they could be included in the 2007 IPCC Report in support of the now obviously faulty MBH study. Despite McIntyre’s criticisms, with cooperation from GRL and CC, the papers were hurriedly provisionally accepted, allowing mention in the 2007 IPCC Report. The Bishop Hill website provides additional details of malfeasance. The Bishop Hill website summarized:
“That the statistical foundations on which they had built this paleoclimate castle were a swamp of misrepresentation, deceit and malfeasance was, to Wahl and Amman, an irrelevance. For political and public consumption, the hockey stick still lived, ready to guide political decision-making for years to come” [5757Hill B. Commentary on the Hockey Stick. http://bishophill.squarespace.com/blog/2008/8/11/caspar-and-the-jesus-paper.html].
Wegman, Scott, and Said [4343Wegman EJ, Scott DW, Said YH. Ad Hoc Committee Report on the hockey stick global climate reconstruction. Washington (DC): The Congressional Committee on Energy and Commerce; 2006 Jul 14. online at https://climateaudit.org/wp-content/uploads/2007/11/07142006_wegman_report.pdf] suggested that the field, reconstruction of the temperature history of the Earth, is dominated by a cadre that is vitally concerned about the potential impacts of global warming, and supports the hockey stick result, as well as the procedure used to derive it. Wegman, Scott, and Said [4343Wegman EJ, Scott DW, Said YH. Ad Hoc Committee Report on the hockey stick global climate reconstruction. Washington (DC): The Congressional Committee on Energy and Commerce; 2006 Jul 14. online at https://climateaudit.org/wp-content/uploads/2007/11/07142006_wegman_report.pdf] said:
“If there is a tight relationship among the authors, and there are not a large number of individuals engaged in a particular topic area, then one may suspect that the peer review process does not fully vet papers before they are published. Indeed, a common practice among associate editors for scholarly journals is to look in the list of references for a submitted paper to see who else is writing in a given area and thus who might legitimately be called on to provide knowledgeable peer review. Of course, if a given discipline area is small and the authors in the area are tightly coupled, then this process is likely to turn up very sympathetic referees. These referees may have co-authored other papers with a given author. They may believe they know that author’s other writings well enough that errors can continue to propagate and indeed be reinforced” [4343Wegman EJ, Scott DW, Said YH. Ad Hoc Committee Report on the hockey stick global climate reconstruction. Washington (DC): The Congressional Committee on Energy and Commerce; 2006 Jul 14. online at https://climateaudit.org/wp-content/uploads/2007/11/07142006_wegman_report.pdf].
Wegman, Scott, and Said (2006) concluded:
“It is immediately clear that Mann, Rutherford, Jones, Osborn, Briffa, Bradley, and Hughes form a clique, each interacting with all of the others.”
McIntyre also discussed the question: “... given the defects of Mann’s principal components, how did the methodology pass peer review and then remain unchallenged by specialists in the field?” McIntyre further stated:
“The Wegman Report hypothesized that this failure was due to the inter-connectedness of climate scientists through co-authorship and in particular by the extent of Mann’s network of co-authorship, a level of inter-connectedness that the Wegman Report seemed to think as not existing in their own field. Wegman speculated that members of Mann’s closest circle (‘clique’ in network terminology) reviewed papers of other members of the clique, resulting in non-independent and weak peer review, which, in turn, had resulted in the failure to identify the incorrectness of Mann’s principal components in both the original article and subsequently” [4545McIntyre S. Climate Audit Website. 2007. online at http://www.climateaudit.org].
Kevin Trenberth, Senior Scientist as the National Center for Atmospheric Research (and not a participant in proxy studies) emerged as a defender of the paleoclimatic community. He summarized his view that the bulk of the evidence against the paleoclimatic community was obtained illegally by hacking emails, implying somehow that the clear evidence against the paleoclimatic community should be disregarded because of the way it was obtained? He also claimed that criticisms were unfounded which is clearly untrue. It seems doubtful that Trenberth knows much about proxy analysis but was acting as a friend to defend CO2 [5858Trenberth K. Communicating climate change: Some lessons from climategate. https://www2.cgd.ucar.edu/staff/trenbert/Presentations/ClimategateS.pdf].
In late 2011, additional emails between participants were hacked. Some of these exposed further chinks in the armor. Self-doubt began to creep in. Referring to the “divergence problem” where important tree proxies actually declined when the climate went up, Tim Osborne urged a dubious method to hide the decline but admitted that “it may be not defensible!” Richard Alley (who was not really a participant, but a fellow traveler in alarmism) was quoted as saying:
“Unless the ‘divergence problem’ can be confidently ascribed to some cause that was not active a millennium ago, then the comparison between tree rings from a millennium ago and instrumental records from the last decades does not seem to be justified, and the confidence level in the anomalous nature of the recent warmth is lowered”.
Another hacked email was reported to have said:
“I am afraid the Mike [Mann] and Phil [Jones] are too personally invested in things now (i.e. the 2003 GRL paper that is probably the worst paper Phil has ever been involved in - Bradley hates it as well), … “
Jonathan Overpeck was quoted as saying:
“... what Mike Mann continually fails to understand, and no amount of references will solve, is that there is practically no reliable tropical data for most of the time period, and without knowing the tropical sensitivity, we have no way of knowing how cold (or warm) the globe actually got.... Unsatisfying, perhaps, since people will want to know whether 1200 AD was warmer than today, but if the data doesn’t exist, the question can’t yet be answered. A good topic for needed future work.”
Tim Osborne was quoted as saying: “Also we have applied a completely artificial adjustment to the data after 1960, so they look closer to observed temperatures than the tree-ring data actually were.”
W. Montford wrote a book that provides a very detailed history, background and review of the entire hockey stick saga and the ensuing “climategate” revelations [4646Montford AW. The Hockey Stick Illusion: Climategate and the Corruption of Science, Stacey International, London, UK. 2010.]. Montford goes into considerable detail on the specifics of the proxy data and how it was processed, as well as the work by M&M in unraveling what MBH actually did, and the errors and misconceptions in the MBH analysis. He describes the resistance put up by the paleoclimatic community and the culpability of journals in shielding them from justified criticism. His penetration into the whole grisly mess is deeper than I have attempted here. As the story unfolds, Montford shows that these paleoclimatologists, with their suspect data, and worse methods of processing the suspect data, have convinced the science community and the world at large into believing their results.
The climate alarmism community
Initially, the paleoclimatic community consisted only of paleoclimatologists. However, as time progressed, the paleoclimatic community was joined by other climatologists not necessarily involved in reconstruction of past millennial climates, who had vested interests in climate alarmism in general, and viewed criticism of the paleoclimatic community as destructive to their cause of proving CO2 was the essential force behind climate change. The paleoclimatic community expanded to become the climate alarmism community dedicated to propagating the orthodoxy of climate alarmism. A new set of emails within climategate appeared in 2011. An exchange of emails between members of the climate alarmism community was revealed. Members appeared to include (amongst others): Tom Wigley, Jonathan Overpeck, Caspar M. Ammann, Raymond Bradley, Keith Briffa, Tom Crowley, Malcolm Hughes, Phil Jones, Tim Osborn, Kevin Trenberth, Ben Santer, Steve Schneider, Malcolm Hughes, Michael E. Mann, Andrew Dessler and Michael Oppenheimer. The goals of the climate alarmism community seem to have been to prevent papers contrary to climate alarmism from getting published, to harass editors that pass contrary papers, to immediately combat any contrary papers or influential blog entries with counter papers and blog entries, and unfortunately in some cases, it appears that personal attacks were considered. They pompously and arrogantly claimed that their interpretations were climate science while work by other climatologists reaching different conclusions is something other than climate science. We see evidence of this in many publications and press releases. For example, Dessler (2011) was a criticism of Spencer’s orbital observations that indicated less warming than ground observations [5959Dessler AE. Cloud variations and the Earth’s energy budget. 2011. https://agupubs.onlinelibrary.wiley.com/doi/full/10.1029/2011GL049236]. Pielke, Sr. said
“It is not clear whether the Editor of GRL included Roy Spencer as one of the referees, [and if they did not] they were derelict in their responsibilities. Dessler’s paper should have been submitted to Remote Sensing as a Comment [on Spencer’s paper]. Then Roy Spencer would submit a Reply” [6060Spencer RW, Braswell WD. On the Misdiagnosis of Climate Feedbacks from Variations in Earth's Radiant Energy Balance. Remote Sensing 3. 2011; 1603-1613. https://doi.org/10.3390/rs3081603.].
Another bizarre aspect of Dessler’s 2011 publication was discussed by Pielke, Sr. He said:
“Dessler’s paper was received 11 August 2011 and accepted 29 August 2011. This is some type of record ... and indicates that the paper was fast-tracked. This is certainly unusual ...” [6161Roger P.Sr. Comments on The Dessler 2011 GRL Paper. Cloud Variations And The Earth’s Energy Budget. 2011. https://pielkeclimatesci.wordpress.com/2011/09/06/comments-on-the-dessler-2011-grl-paper-cloud-variations-and-the-earths-energy-budget/.].
The climatology orthodoxy seems to have united into an informal association dedicated to (1) prevent contrary analyses and interpretations from being published, and (2) to quickly respond to those few contrarian publications that slip through their net with vitriolic attacks on the paper on orthodoxy blogs, and in the literature via rapid rebuttal publications such as that of Dessler [5959Dessler AE. Cloud variations and the Earth’s energy budget. 2011. https://agupubs.onlinelibrary.wiley.com/doi/full/10.1029/2011GL049236]. It seems evident that editors were in league with the orthodoxy; certainly, the editor of GRL was, and the editor of Remote Sensing who let Spencer and Bradwell’s paper through the net, suddenly resigned for unclear reasons.
If persistent El Niños since 1976 were important in causing warming in the Northern Hemisphere in the latter part of the 20th century, it would suggest that the role of CO2 in climate change might be less than is accepted by the orthodoxy. McLean, et al. [6262McLean JD, de Freitas CR, Carter RM. Influence of the Southern Oscillation on tropospheric temperature. J Geophys Res. 2009;114(D14):D14104. DOI:10.1029/2009JD013006.] concluded that the El Niño index:
“... is a dominant and consistent influence on mean global temperature… and natural climate forcing associated with ENSO is a major contributor to variability and perhaps recent trends in global temperature, a relationship that is not included in current global climate models” [6262McLean JD, de Freitas CR, Carter RM. Influence of the Southern Oscillation on tropospheric temperature. J Geophys Res. 2009;114(D14):D14104. DOI:10.1029/2009JD013006.].
After McLean, et al. (2009) was published, a flurry of emails was exchanged between climate alarmism community members, strategizing on how to carry out damage control by preparing a rebuttal. Soon afterward, a group of participants (Grant Foster, James Annan, Phil Jones, Michael Mann, Jim Renwick, Jim Salinger, Gavin Schmidt and Kevin Trenberth) prepared a rebuttal, and to ensure speedy publication, they pressured the editor of the Journal of Geophysical Research and suggested the following persons as possible reviewers for their submitted critique: Ben Santer, Dave Thompson, Dave Easterling, Tom Peterson, Neville Nicholls, and David Parker (with Tom Wigley, Tom Karl and Mike Wallace also mentioned). All of these were professionally associated in some way and are thought to be members of the climate alarmism community. Phil Jones commented: “All of them know the sorts of things to say - about our comment and the ‘awful original’, without any prompting.” (They all subscribe to the same orthodoxy). The use of multiple authors listed mainly to show support without contributing much to the content was typical – but it is not science.
In their rush to rebut the original McLean article, the climate alarmism community posted their rebuttal on a website, in violation of JGR rules. The results of McLean, et al. (2009) would seem to be a major stumbling block for alarmists who attribute most (if not all) of the warming of the 20th century to greenhouse gases. It is therefore not surprising that the alarmists struck back with members of the climate alarmism community publishing Foster, et al. (2010), that claimed that the results of McLean, et al. (2009) “are seriously in error” and concluded “In fact, the general rise in temperatures over the 2nd half of the 20th century is very likely predominantly due to anthropogenic emissions of greenhouse gases” [6363Foster G, Annan JD, Jones PD, Mann ME, Renwick J, Salinger J, Schmidt GA, Trenberth KE. Comment on “Influence of the Southern Oscillation on tropospheric temperature” by JD McLean, CR de Freitas, and RM Carter. J Geophys Res. 2010;115(D9):D09110. DOI:10.1029/2009JD012960.]. Foster, et al. (2010) constituted a rather vicious criticism of McLean, et al. (2009), but JGR refused to publish McLean’s response. Evidently, the JGR was acting in collusion with the climate alarmism community, and probably regrets that McLean, et al. (2009) slipped through the editorial process. McLean, et al. attempted to rebut the criticism by Foster, et al. (2010), but the Journal of Geophysical Research (JGR) refused to publish it. Their rebuttal was published as McLean (2010) [6464McLean JD. Censorship at AGU: scientists denied the right of reply. 2010. http://icecap.us/images/uploads/McLeanetalSPPIpaper2Z-March24.pdf.].
There are several important aspects of this episode that require further elaboration. These include (1) technical aspects, (2) attitudes and collusion amongst climate scientists, and (3) collusion of the JGR with climate scientists.
Regarding technical aspects, the issue revolves about methods used for filtering in statistical processing of data. Foster, et al. (2010) made some valid criticisms of specific details, but these do not negate the strong correlation of the El Niño index with climate change. Undoubtedly, the contribution of the El Niño index is considerably less than the 70% claimed by McLean, et al. (2009), but clearly the El Niño index is a factor in climate change. It seems doubtful that there is sufficient data and analytical insight to pin down its quantitative share in influencing climate change. McLean (2010) presented excerpts from the climategate emails that clearly show that the climate alarmism community regarded McLean, et al. (2009) as a threat to their orthodoxy, and they colluded together to disparage McLean, et al. (2009). The climate alarmism community seems to regard itself as a police force to eradicate any contrary evidence or analysis that would refute their total emphasis on greenhouse gases.
McLean, et al. submitted a response to the published comment by Foster, et al. but the JGR sent their response to Foster’s group for review – like asking the fox to guard the henhouse. Needless to say, the McLean response was rejected and never published by JGR.
It is well known that transitions between El Niños and La Niñas have a significant short-term impact on global temperature [33Rapp D. Assessing climate change. 3rd ed. Heidelberg (Germany): Springer-Praxis Books; 2018.]. If the frequency of occurrence of El Niños and La Niñas averages out over time, the El Niños and La Niñas will impose variations along the path of the global average temperature with time but will not change the path. However, during the period 1980 to 2000 there was a predominance of El Niños as shown in Figures 15,16.
33Rapp D. Assessing climate change. 3rd ed. Heidelberg (Germany): Springer-Praxis Books; 2018.]." /> Figure 15: Variation of Nino index from 1980 to 2010 [33Rapp D. Assessing climate change. 3rd ed. Heidelberg (Germany): Springer-Praxis Books; 2018.].
33Rapp D. Assessing climate change. 3rd ed. Heidelberg (Germany): Springer-Praxis Books; 2018.]." /> Figure 16: Integral of the Southern Oscillation Index (SOI) anomaly from 1950 to 2000. (Negative values of SOI indicate predominance of El Niños) [33Rapp D. Assessing climate change. 3rd ed. Heidelberg (Germany): Springer-Praxis Books; 2018.].
Douglass (2010) pointed out that commonly used El Niño indices contain an unwanted effect from the annual cycle that can be reduced by digital filtering [6565Douglass DH. El Niño Southern Oscillation: Magnitudes and asymmetry. J Geophys Res. 2010;115(D15):D15111.]. He then developed an improved El Niño index dating from 1856. He analyzed the occurrences of major El Niño and La Niña events in some detail and pointed out the existence of a basic asymmetry favoring El Niños in recent times. While Douglass (2010) restricted his attention to peak values of the index, it is also instructive to integrate the El Niño index over time. The result is shown in Figure 17. This shows that from ~1860 to ~1910, the El Niño and La Niña events were quite balanced. There was a predominance of El Niño events from about 1910 to ~1940, followed by a predominance of La Niña events from ~1940 to the late 1970s. Starting around 1980, El Niño events again became strongly dominant. The integral of the Niño index is roughly parallel to global temperature variability, suggesting that El Niño and La Niña events were associated with a significant part of the global temperature change in the past century and a half (Figure 18). The index itself seems to correlate well with the tropospheric temperature.
6565Douglass DH. El Niño Southern Oscillation: Magnitudes and asymmetry. J Geophys Res. 2010;115(D15):D15111.]." /> Figure 17: Integral of Douglass’ modified El Niño index [6565Douglass DH. El Niño Southern Oscillation: Magnitudes and asymmetry. J Geophys Res. 2010;115(D15):D15111.].
33Rapp D. Assessing climate change. 3rd ed. Heidelberg (Germany): Springer-Praxis Books; 2018.,6565Douglass DH. El Niño Southern Oscillation: Magnitudes and asymmetry. J Geophys Res. 2010;115(D15):D15111.]." /> Figure 18: Comparison of Douglass’ modified El Niño index and its integral with measured global surface temperature anomalies and tropospheric temperature anomalies [33Rapp D. Assessing climate change. 3rd ed. Heidelberg (Germany): Springer-Praxis Books; 2018.,6565Douglass DH. El Niño Southern Oscillation: Magnitudes and asymmetry. J Geophys Res. 2010;115(D15):D15111.].
The standard climate models used by climate scientists predicted a warming at altitudes of 5 km to 8 km. Douglass, et al. (2007) compared the models to data and found disparities, suggesting the models were faulty [6666Douglass DH, Christy JR, Pearson BD, Singer SF. A comparison of tropical temperature trends with model predictions. Int J Climatol. 2007;27(13):1653–64. DOI: 10.1002/joc.1651]. Previous publications by some members of the climate alarmism community claimed the models were excellent. After publication of Douglass, et al. (2007), the climate alarmism community prepared a rebuttal with seventeen co-authors published as Santer, et al. [6767Santer BD, Thorne PW, Haimberger L, Taylor KE, Wigley TML, Lanzante JR, Solomon S, Free M, Gleckler PJ, Jones PD, Karl TR, Klein SA, Mears C, Nychka D, Schmidt GA, Sherwood SC, Wentz FJ. Consistency of modeled and observed temperature trends in the tropical troposphere. Int J Climatol. 2008;28(13):1703–22.https://doi.org/10.1002/joc.1756.]. It is not clear how seventeen people contributed to this paper; likely it was mainly a vote of confidence? It might have been politics. It might have been journalism. It might have been fellowship. But it certainly wasn’t science. Santer, et al. (2008) begins with the sentence: “There is now compelling scientific evidence that human activities have influenced global climate over the past century” which is a necessary first sentence in papers in our time to assuage the editors that the writers are on the right team. The details of the statistical processing of large data sets are complex. The issue is whether tropical tropospheric temperatures have risen more than surface temperatures as climate models would predict for the effect of greenhouse gases on climate. Douglass, et al. (2007) concluded that models and data disagreed to “a statistically significant extent”. Santer, et al. (2008) claimed to achieve a “partial resolution of the long-standing ‘differential warming’ problem” although they also said:
“We may never completely reconcile the divergent observational estimates of temperature changes in the tropical troposphere. We lack the unimpeachable observational records necessary for this task. The large structural uncertainties in observations hamper our ability to determine how well models simulate the tropospheric temperature changes that actually occurred over the satellite era. A truly definitive answer to this question may be difficult to obtain.”
Yet, this did not prevent Santer, et al. from producing a so-called “Fact Sheet”that said “We’ve gone a long way towards such a reconciliation” [between climate models and tropical tropospheric temperatures]. Which is doubtful.
Subsequently, in 2009, McIntyre pointed out that when the data used by Santer, et al. (2008) (that ended in 1999) is extended through 2008, the discrepancy reported by Douglass remains, and “the claim by Santer, et al. (2008) to have achieved a ‘partial resolution’ of the discrepancy between observations and the model ensemble mean trend is unwarranted”. McIntyre also noted the difficulty in obtaining data from Santer, et al. and indicated that the International Journal of Climatology (IJC) was stalling in responding to him. It appears that McIntyre’s article never passed through the group’s lock on the IJC, and McIntyre had to be content with merely archiving his article on climateaudit.org. Yet, alarmists continue to refer to Santer, et al. (2008) as evidence that climate models have been adequately tested.
Douglass and Christy presented evidence for their claim that Ben Santer, Phil Jones, Timothy Osborn, Tom Wigley, and 13 other climate alarmism community members apparently conspired to compromise the peer review process, with the willing cooperation of the editor of the International Journal of Climatology (IJC), Glenn McGregor. This evidence involved dozens of e-mails over nearly a year, suggesting “(a) unusual cooperation between authors and editor, (b) misstatement of known facts, (c) character assassination, (d) avoidance of traditional scientific give-and-take, (e) using confidential information, (f) misrepresentation (or misunderstanding) of the scientific question posed by Douglass, et al. (2007), (g) withholding data, and more.” Unfortunately, that website has been lost. What remains is several websites by climate alarmist trolls such as desmog, real climate and deep climate, all repeating lies and distortions.
An example of the need by the climate alarmism community to respond to challenges by contrarians is the paper by Santer, et al. (2011). [6868Santer BD, Mears C, Doutriaux C, Caldwell P, Gleckler PJ, Wigley TML, Solomon S, Gillett NP, Ivanova D, Karl TR, Lanzante JR, Meehl GA, Stott PA, Taylor KE, Thorne PW, Wehner MF, Wentz FJ. Separating signal and noise in atmospheric temperature changes. J Geophys Res Atmos. 2011;116(D2):D22105. https://doi.org/10.1029/2011JD016263.] This paper was concerned that measurements indicated that tropospheric temperatures had not risen since 1998 despite continued increases in CO2 concentration, contrary to predictions of climate models. The paper had seventeen authors in an expression of support by the climate alarmism community although it is difficult to figure out what contributions (if any) were made by the various authors. The listing of these authors seems to be more a political statement than a scientific statement. The goal was to produce an analysis that concludes that temporary periods with no temperature gain may be viewed as a temporary fluctuation superimposed on an ever-present underlying upward trend due to rising greenhouse gas concentrations. The logic of the paper is quite shaky however (as discussed by Rapp (2018)) [33Rapp D. Assessing climate change. 3rd ed. Heidelberg (Germany): Springer-Praxis Books; 2018.]. (In 2025, most journals now require that the authors must specify in detail the contribution of each author to the manuscript.)
The participants might try to defend themselves by arguing that they believed that the world was in danger, and it was necessary to build world dedication to fighting climate change, even if some subterfuge was used. They viewed McIntyre and others not in the “club” of climate scientists as interlopers who were not qualified. However, the issues were not climatic but rather a matter of statistics and McIntyre was far more expert in statistics than the climate alarmism community. Furthermore, the climate alarmism community also battled against legitimate climate scientists (Douglass, Lindzen, McLean, Spencer, …) when they obtained results that disagreed with the alarmist view. The paleoclimate participants might have tried to present themselves as torchbearers saving humanity, but the evidence suggests they were mainly trying to protect their professional reputations by covering up their mistakes? But we might also ask how and why they believed the world was in danger? What specific research results led to that conclusion? It is difficult to find any. Furthermore, it is not clear whether they even understood how the greenhouse gas effect works. It seems likely that despite all their fear of greenhouse gases, they probably didn’t understand how greenhouse gases warm the Earth? [6969Rapp D. How increased CO2 warms the Earth—two contexts for the greenhouse gas effect. IgMinRes. 2024 Oct 24;2(10):854–9. IgMin ID: igmin259. DOI: 10.61927/igmin259; Available at: igmin.link/p259] Climate change offered a great boon to climate scientists. It is difficult to determine whether their concern was for the world or their own self-interest?
The National Academy of Sciences Report and Ed Wegman
Responding to criticism of the hockey stick result proclaimed by the climate alarmists, and heavily endowed with political overtones, the U.S. House of Representatives in 2006 ordered a review "to summarize current scientific information on the temperature record for the past two millennia, describe the main areas of uncertainty and how significant they are, describe the principal methodologies used and any problems with these approaches, and explain how central is the debate over the paleoclimate temperature record to the state of scientific knowledge on global climate change."
A committee of climate scientists was appointed by the National Research Council and their report appears to have more or less rubber stamped the MBH findings after cursory inspection. Had they carried out a serious review they would have uncovered the many errors discussed herein.
A second report was authorized through the National Academy of Sciences, and Ed Wegman, a prominent professor of statistics (but not a climatologist) led the ensuing study. Several staff and graduate students (also statisticians) contributed. This report was not basically about climate itself, but rather the statistical methods used by MBH to process the data, which was independent of climatology and required little specific knowledge of the proxies. He prepared a criticism of the MBH study that was fully accurate and justified on all counts as tabulated below [4343Wegman EJ, Scott DW, Said YH. Ad Hoc Committee Report on the hockey stick global climate reconstruction. Washington (DC): The Congressional Committee on Energy and Commerce; 2006 Jul 14. online at https://climateaudit.org/wp-content/uploads/2007/11/07142006_wegman_report.pdf].
The writing of MBH was obscure and incomplete. (This writer found the same.)
They found the criticisms by M&M to be valid and their arguments to be compelling. Serious mistakes were made in statistical analysis. (As already shown herein.)
Use of the temperature profile in the 1902–1995 timespan for centering leads to misuse of the principal components analysis. (They should have used the entire range of data).
The use of the period 1902 to 1995 as the calibration period was inappropriate because that was a period when the temperature was rising and it was not representative of the much longer entire data set.
The cryptic nature of some of the MBH narratives requires that outsiders would have to make guesses at the precise nature of the procedures being used.
The paleoclimatology community did not recognize the validity of the M&M papers and web pages and dismissed them as being developed by biased amateurs (probably without reading them?). The paleoclimatology community seems to be tightly coupled as indicated by a social network analysis, and rallied around the MBH position, even though it was faulty.
The absence of the MWP and the LIA from the MBH result supported the widely quoted assessments that the decade of the 1990s was the hottest decade in a millennium and that 1998 was the hottest year. The paucity of data in the early years makes the hottest-in-a-millennium claims essentially unverifiable.
Use of bristlecone pine proxies are inappropriate because they were probably CO2-fertilized. It is not surprising therefore that this important proxy in MBH yields a temperature curve that is highly correlated with atmospheric CO2. There are clearly confounding factors for using tree rings as temperature signals.
Of particular importance was the fact that MBH centered the data based on the calibration period (1900 to 1995) mean rather than the mean for the entire time span of the data set. Since CO2 was increasing during the calibration period, and CO2 fertilized important tree proxies, this created a situation where the statistics algorithm preferentially heavily weighted these few proxies, thus artificially producing a non-scientific hockey stick shape for the temperature vs. time graph. This is illustrated in Figure 19.
4343Wegman EJ, Scott DW, Said YH. Ad Hoc Committee Report on the hockey stick global climate reconstruction. Washington (DC): The Congressional Committee on Energy and Commerce; 2006 Jul 14. online at https://climateaudit.org/wp-content/uploads/2007/11/07142006_wegman_report.pdf]." /> Figure 19: Comparison of rework of the North American tree network PC1 using MBH centering vs. using centering across the entire time span of the data set. The hockey stick is shown to be an artifice. Adapted from Wegman, Scott, and Said [4343Wegman EJ, Scott DW, Said YH. Ad Hoc Committee Report on the hockey stick global climate reconstruction. Washington (DC): The Congressional Committee on Energy and Commerce; 2006 Jul 14. online at https://climateaudit.org/wp-content/uploads/2007/11/07142006_wegman_report.pdf].
There are other detailed statistical problems with the MBH treatment that require specialized knowledge to understand.
In addition to Wegman’s technical analysis, he also commented on social networking of authors in temperature reconstructions. He said:
“If a given discipline area is small and the authors in the area are tightly coupled, then this process is likely to turn up very sympathetic referees. These referees may have coauthored other papers with a given author. They may believe they know that author’s other writings well enough that errors can continue to propagate and indeed be reinforced.”
Wegman went on to point out that the emails indicate that Michael Mann was closely coupled to essentially all the major players in his field, and these form a set of mutually reinforcing researchers that appear to defy objectivity. Wegman described the paleoclimatic community using some fascinating graphs to depict connections between members.
For that, Wegman came under attack by members of the paleoclimatic community.
Unlike paleoclimatic community members who were legitimate climate scientists and operated mainly at the professional publication level, there also arose fellow travelers of the paleoclimatic community, such as Naomi Orestes who used any means to promulgate the alarmist persuasion. The most obnoxious trolls for climate alarmism such as deepclimate.org made personal attacks on anyone who did not fully subscribe to their orthodoxy. Their mechanism for doing this was to accuse Wegman of plagiarism. This seems to have originated on the deepclimate.org website where a scurrilous person hiding behind a cloak of anonymity known as “DC” apparently stayed up nights comparing word-for-word the Wegman report with references to identify passages that were copied or slightly modified. This was further propagated by a report written by a person identified “John Mashey”. DC and Mashey succeeded in their goal, which was to divert attention from the technical errors in the MBH research, and focus attention entirely on the trivial issue of trumped-up claims of plagiarism by Wegman. There have been innumerable nonsensical blog entries by climate alarmist trolls claiming plagiarism in the Wegman Report, whereas the perpetration of false science by the paleoclimatic community was mainly ignored.
Bouville (2008) wrote a treatise on plagiarism. He said:
“... even though ... copying other people’s intellectual contribution is wrong, they do not apply to the copying of words. Copying a few sentences that contain no original idea (e.g. in the introduction) is of marginal importance compared to stealing the ideas of others. The two must be clearly distinguished, and the ‘plagiarism’ label should not be used for deeds that are very different in nature and importance” [7070Bouville M. Plagiarism: words and ideas. Sci Eng Ethics. 2008 Sep;14(3):311-22. doi: 10.1007/s11948-008-9057-6. PMID: 18368537.].
Plagiarism involves “intentionally, knowingly and recklessly” copying other people’s intellectual property. The point is that plagiarism is only a serious malpractice when an intellectual concept is stolen for personal gain. When background material is presented without attribution, that is an inadvertency or an indiscretion, but not a crime. The thrust of the Wegman Report was twofold: (1) the hockey stick was based on bad science, and (2) collusion between members of the paleoclimatic community allowed the hockey stick to get repeatedly published and promulgated despite the serious errors in the methods used. Both assertions were true and provable. There was no plagiarism in these elements of the Wegman Report. Indeed, it seems impossible for a technical review to be plagiaristic because the reviewer makes no claims for originality, and is only interested in determining the validity of other’s intellectual property. The Wegman report made no claims that Wegman, et al. in the slightest degree claimed ownership of any of the work by MBH. Because the Wegman team were statisticians (not climatologists) and only investigated the statistical manipulation of data, they thought it helpful to provide a short introduction with a background on proxies and how they work. Since they were not experts themselves, they utilized some text written by experts. In the spirit of Bouville’s paper, who cares?
How can you write an introduction to a paper on paleoclimate? You’d have to avoid the plagiarism police by restating what’s been said a hundred times in new words. You could start off by saying:
“A proxy such as tree rings are a measurable quantity that is believed to be a measure of current temperature.”
But then, those words might have already been used, so maybe you could try to say:
“You can estimate past temperatures using a proxy that reflects the temperature.”
You could say the same thing in a hundred ways, but beware the plagiarism police. Probably, it would be a great step forward if a universal introduction were written using AI, and utilized by all published papers regarding paleoclimatic matters in which the use of proxies is briefly explained. Then all papers would use the same introduction and no claims of plagiarism of introductory material would be possible. A great step forward for mankind?
It is interesting that both DC and Mashey accused me of plagiarism as well in my book [33Rapp D. Assessing climate change. 3rd ed. Heidelberg (Germany): Springer-Praxis Books; 2018.]. My book: Assessing Climate Change contains 1,348 specific citations to references giving credit to authors for their work. It also includes 411 specific quotations of authors with their own words included in quote signs in my book. Anyone with any sense can immediately see that with 1,348 citations of references and 411 direct quotes, I could hardly have “intentionally, knowingly and recklessly” copied other people’s intellectual property. Indeed, since the book was a review of other people’s work, and no claim was made for new original ideas in the book, nothing of any value was involved in any way.
In the aftermath of these ignorant charges of plagiarism against Wegman and co-workers, Wegman and Said were relieved of their editorship of WIRES and Wegman was admonished publicly by his University Provost and had a letter of reprimand publicly placed on his file; Wegman and Said had their paper retracted. However, a George Mason University committee investigated the charges. Their conclusion was that charges of scientific misconduct led to a unanimous finding that “no misconduct was involved”. It was also stated that “Extensive paraphrasing of another work did occur, in a background section, but the work was repeatedly referenced and the committee found that the paraphrasing did not constitute misconduct.”
It seems clear from all these examples that John Mashey and the plagiarism police are running rampant with wild, unjustified and plainly stupid microscopic searches for common words, while the greater implications of the relationship of one written work to another are missed. Review articles cannot be plagiaristic because reviews make no claims for original ideas, but merely comment on the veracity of the ideas of others. In short, Mashey and his henchmen can’t see the forest for the trees.
About fifteen years passed, and Andrew Gelman, a professor of statistics at Columbia University (and seemingly not very bright) published a web posting in which he briefly discussed the Wegman case, and others wrote in [7171Gelman A. Weggy time: A (conceptual) blast from the past. Stat Model Causal Inference Soc Sci. 2023. https://statmodeling.stat.columbia.edu/2023/08/18/weggy-time-a-conceptual-blast-from-the-past/]. Most of commentators (including John Mashey) continued to make a mountain out of the Wegman plagiarism molehill.
The lawsuit
In 2009, about a thousand emails were hacked from a server at the University of East Anglia’s Climate Research Unit (CRU). The UAE CRU was heavily involved in modeling the climate over the past two millennia, were in frequent communication with Mann, and co-published with Mann. These emails are well documented by Mosher and Fuller and by Montford who exposed the paleoclimatic community as a group of devious climatologists who apparently resorted to unscientific actions to cover up their mistakes while attacking anyone with different viewpoints [4242Mosher S, Fuller TW. Climategate: The CRUTape letters. Self-published; 2010.,4646Montford AW. The Hockey Stick Illusion: Climategate and the Corruption of Science, Stacey International, London, UK. 2010.].
As a result, several institutions and organizations conducted inquiries into the matter, and all of them whitewashed their reviews. These included the following, adapted from a posting on a website by McIntyre:
Muir Russell report: This report was carried out by the University of East Anglia (UEA) to review the issues arising from release of 1073 UEA emails. The review was mainly intended to whitewash UEA and mainly bypassed Mann.
Oxburgh report: This was a whitewash of the Climatic Research Unit of the UAE for the House of Commons. Mann was not mentioned.
Penn state inquiry: This taken from the original filing of the lawsuit:
“In 2010, Penn State tasked its Investigatory Committee, “appointed by University administrators and comprised entirely of Penn State faculty members,” to investigate Plaintiff in connection with the CRU emails. Id. at 10. Plaintiff was cleared of three of the four substantive charges against him. The decision by the investigative group was apparently based on an interview with Plaintiff. Defendants claim that the Committee failed to interview any scientist who had previously been critical of Plaintiff’s work. Penn State investigated the last charge (which involved Plaintiff’s research and an allegation that it might “deviate from accepted research norms) through an interview with Professor Richard Lindzen of MIT, a critic of Plaintiff’s work, who later “expressed dismay with the scope of the investigation and the Committee’s analysis of the East Anglia emails.”
National Science Foundation (NSF) Close-Out Memo: investigated allegations of plagiarism, rather that malfeasance by Mann and the paleoclimatic community. It is not clear who wrote the memo or did the underlying work.
EPA reconsideration of endangerment finding: The EPA concluded there was “no evidence of scientific misconduct.”
National Science Foundation: A subsequent investigation of Plaintiff’s work was conducted, by the National Science Foundation which concluded: "Lacking any direct evidence of research misconduct, ... we are closing this investigation with no further action."
The MBH publications were clearly faulty as we have shown from the simplest consideration that choosing the wrong mean leads to mining the data for a hockey stick shape, plus other problems and fabrications as discussed by M&M at length. The issue of choosing the wrong mean is not difficult to comprehend. Even a high school student can understand this. Other problems with the hockey stick, notably “hide the decline” were claimed to be only a poor choice of words, rather than what it really was: fakery. The institutions conducting the inquiries evidently locked arms with their own scientists and whitewashed the clear and convincing criticisms of M&M.
In 2012, totally independent of climate matters, an FBI investigation was conducted of allegations of sexual abuse by Jerry Sandusky, a Penn State assistant football coach who committed a series of crimes over years and was not apprehended by Penn State. The FBI concluded that Penn State had failed to properly investigate known allegations of misconduct when they arose. The FBI also claimed that the culture at Penn State “placed the avoidance of the consequences of bad publicity above virtually every other value.”
Rand Simberg (of the National Review) published an Internet post in which he compared the Sandusky scandal to Penn State’s failure to properly handle the matter in the Penn State’s investigation into Mann’s work. Soon after, Mark Steyn (also of the National Review) published an article defending Simberg’s commentary, although Steyn indicated he was “not sure he would have extended the metaphor all the way into the locker-room showers with quite the zeal Mr. Simberg does”. Steyn also stated: “Michael Mann was the man behind the fraudulent climate-change hockey stick graph, the very ringmaster of the tree-ring circus”. Steyn concluded the piece by enumerating the similarities between Penn State’s inadequate investigation into allegations of misconduct by both Sandusky and Plaintiff, and “questioned the university’s similar handling of the two matters.”
Any reasonable person could conclude that Steyn’s criticism of Mann’s hockey stick was valid, and that the FBI’s description of Penn State’s culture protecting itself by refusing to properly investigate internal malfeasance or criminal activity was valid. But the major criticism here should have been against Penn State. Nevertheless, comparing Mann’s transgressions to Sandusky’s was excessive, like comparing a mouse to an elephant. Steyn and especially Simberg were grossly improper comparing Mann to Sandusky.
In 2012, Michael Mann filed a lawsuit against the National Review, Mark Steyn, and Rand Simberg. In that lawsuit, Mann claimed that the Defendants knew fraud was nonexistent, or deliberately ignored evidence that their accusations of fraud, misconduct or data manipulation were false. Mann claimed that multiple government and academic institutions exonerated him and that the Defendants were aware of this. In the process, Mann asserted that comparison to Sandusky caused him to experience “fright, horror, grief, shame, humiliation, embarrassment, anger, chagrin, disappointment, worry and nausea.” More to the point, Mann said that he lost large amounts of grant funding.
The defense provided by Simberg and Steyn was based on freedom of speech. That was probably a mistake. Perhaps a technical defense, in which statistics experts like M&M, Wegman would testify that the hockey stick was bogus. Therefore, the statements made by the Defendants would be supported by fact.
The case dragged on for about a dozen years and finally, trial was held in 2024. Mann won at trial against Rand Simberg and Mark Steyn; the jury ordered Simberg to pay a mere $1 in compensatory damages and $1,000 for punitive damages, while Steyn was hit with $1 in compensatory damages and a shocking $1 million in punitive damages.
A few months later, in 2025, the case was reviewed again, and the result was changed remarkably. The punitive damages against Steyn were reduced from $1,000,000 to $5,000. In addition, Mann was ordered to pay $500,000 for the Simberg/Steyn court costs. This was based primarily on the finding that Mann’s claim of lost grant funding resulting from the publications by Simberg and Steyn were false, and Mann had lied to the jury.
The Counsel’s argument that “these attacks on climate scientists have to stop” was particularly egregious because both this Court and the Court of Appeals repeatedly made clear that this case was not about climate science, let alone “attacks on climate scientists.” The Court of Appeals went through great efforts to ensure that the case does not get into the realm whether there is or is not global warming, or climate change, or more to the point, whether Mann’s publications were proper climate science. Counsel’s insistence that “these attacks on climate scientists have to stop” inflamed the jury, which imposed $1 million in punitive damages on Mr. Steyn. Instead, the case was one of defamation. Later, this was reversed.
The events discussed in this article began with the publication of the articles known as “MBH” in 1998 and 1999. Further events mainly occurred in the next decade. Yet the aftermath of continued down to the present day when a court case related to the MBH papers was finally settled in 2025.
It is important to review these events because they alert us to the fact that climate scientists in their zeal to promulgate alarmist views, have apparently engaged in unprofessional behavior, manipulating data and hiding errors, and acting together in unison to defend dubious work – as evidenced by thin papers with many authors, while shutting out proper analysis from publication in journals.
Climate scientists of the time were intent on demonstrating that rising CO2 was controlling the climate. The MBH papers attempted to do by showing that the average global temperature over the last 1,000 to 2,000 years was relatively flat for about 1,900 years and suddenly went up in the last century as CO2 increased. The idea was to show a “hockey stick” form for the data. This depended on a collection of proxies which were measurements in nature that indicated yearly temperatures over many years. The MBH papers were followed by similar studies by other groups, using similar techniques. They all generated hockey stick results in one form or another, although no two results were similar in detail.
These studies involved two basic steps:
(1) Assembling the proxies, using the last ~100 years to calibrate them, and estimating historical temperature back as far as 2,000 years from the proxies. The various proxies related to specific localities for specific durations.
(2) Using sophisticated statistical procedures to estimate a global or hemispheric average temperature from the individual proxy data. (This was a matter of statistics, and it was not necessary to be a climate scientist to carry out this task.)
Starting around 2005, and continuing to the present day, two experts in statistics (not involved in climate science) took it upon themselves to review and analyze in detail the MBH papers as well as several of the related papers that estimated global or hemispheric temperatures over the past 2,000 years. They discovered serious errors and “tricks” that vitiated the results of the various publications.
The most serious error is simple to understand. The data exists as a yearly temperature series for each proxy. The data for any temperature series are “standardized” by converting original data to deviations from the mean. This is accomplished by first finding the mean of all the data, then subtracting the mean from each data point, so each point is now measured as a deviation from the mean, and scaling by dividing by the standard deviation of the entire data set. This re-centers and re-scales all the data to a mean of zero and measures deviations from the mean in units of the standard deviation.
In the MBH program, the mean chosen for standardization was that for the calibration period, not the entire data set. While this may appear innocuous at first glance, it has crucial consequences for the results derived from this procedure. The statistical analysis does not treat all proxy temperature series equally. It does not simply add up all the proxies and average them. It weights individual data series by their deviations from the mean. By choosing the wrong mean, the statistical analysis would, in effect, sift through a data set and identify those few proxy series with a 20th-century up-trend (some of these proxies were problematic), and then load almost all the weight onto these series. In effect it data-mines for hockey stick trends in a few series. It is ironic that MBH and the others were seeking a hocky stick result, and the error they made assured that they would get one!
Instead of admitting their error and making corrections, the climate scientists continued to believe their work was valid and seemingly ignored the criticism.
The proxy analysis was heavily dependent on tree rings. However, several of the vital tree ring sources went down when temperatures were rising late in the 20th century. Instead of admitting that these were not valid proxies, they were retained, but the period when there was divergence from reality was omitted as stated by climate scientists via: “hide the decline”.
Climate scientists defended the CO2 hypothesis by vigorously opposing papers that showed that El Ninos also affected climate, and that the alarmist climate models had internal inconsistencies. Had they approached this through professional scientific methods, it would have been acceptable. However, they instead published questionable rebuttals, enlisting numerous authors who contributed little beyond votes of confidence, thereby transforming a scientific debate into a political one.
The ironic thing about this history is that with the passage of time, the Earth has warmed a great deal more, and now the argument in favor of CO2 as the major driver of current climate is far stronger than it was 20 years ago. The temperature excursions of the LIA and the MWP were almost surely smaller than the warming of the last 100 years. The unnecessary damage done to climate science by climate scientists might never be recoverable.
We might ask ourselves how the situation might be improved in the future? Several points are suggested:
(1) The proxies that are available might not be adequate in terms of geographic coverage, timescale, or accuracy to reasonably estimate global temperatures over the past two millennia. This might impose a fundamental limitation on what is possible.
(2) The methods of statistical processing of proxy data included serious faults, and these seem to have propagated from 1998 to 2019. The climate scientists are living in ivory towers, and they are ignoring valid criticism. They need to be responsive to all criticism, whether published in their favorite journals, or not.
(3) The all-important comparison of proxy data with temperature data during the calibration period is typically either under presented or not presented at all. This data is crucial and should be prominently displayed.
(4) These papers should not be written terse with undefined lingo. They should be readable by any scientist.
(5) For a narrowly defined segment of climate science where there is a communal association of participants, the peer review system breaks down, and journal editors serve their biases. A different method of peer review is needed, and some journal editors need to be replaced.
(6) The identification of roles needs to be vigorously pursued when large numbers of authors are attached to a paper; else papers gain weight by votes of confidence.
(7) Estimation of global temperatures over 2,000 years requires consideration of the full range of information, including anecdotal information. A 1600 oil painting of a frozen lake is information, albeit limited.
Note added in proof: McIntyre and McKittrick wrote a review of the events near late in the 20th century [7272McIntyre S, McKitrick R. CLIMATEGATE untangling myth and reality ten years later. 2019. https://www.rossmckitrick.com/uploads/4/8/0/8/4808045/climategate.10yearsafter.pdf]. They reviewed and summarized many aspects of the material discussed herein. Much of this overlaps with the present manuscript. This included (briefly):
(1) Inadequacy of various tree ring proxies and machinations regarding that data.
(2) Refuting the claim that the climategate emails were “taken out of context”, particularly those containing terms such as “dirty laundry” that they didn’t want others to find, and “hide the decline” where they hid the faults inherent in tree ring data.
(3) Not including the important statistical measure of validity “r2” which was exceptionally small at 0.018.
(4) Inadequacy of the fit between proxies and temperature during the calibration period. This was referred to as “dirty laundry” in the emails.
(5) Hiding the decline of late 20th century tree ring data via “Mike’s Nature trick” which would have “diluted the message” thus providing “a nice tidy story”.
(6) More details on the institutional reviews that whitewashed Mann’s work.
Note added in proof: In 2019, a consortium of 20 climate scientists revisited the use of proxies to estimate the global average temperature over the past two millennia, utilizing seven methods [7272McIntyre S, McKitrick R. CLIMATEGATE untangling myth and reality ten years later. 2019. https://www.rossmckitrick.com/uploads/4/8/0/8/4808045/climategate.10yearsafter.pdf]. Their final graphs show some variation. Their Figures 1b and 2 show a relatively flat profile for 1900 years with no evidence of the MWP or the LIA, followed by a very moderate rise in the 20th century, only vaguely resembling a hockey stick. Their Figure 1a shows a distinct LIA but no MWP with a moderate hockey stick, extended (without mention) in a misleading way by data rather than modeled results. (The graph calls this “instrumental target” whatever that means – but it is not the result of the proxy model, and it doesn’t belong there). It is not clear why these plots differ. The temperature anomalies are all negative in Figure 1a, suggesting that the (wrong) mean for the calibration period might have been used. There is no mention at all of the work by McIntyre and McKittrick. There is no discussion or data presented on the comparison of temperature to proxy data during the calibration period. The discussion of the roles of the 20 contributors to this paper was very brief and unconvincing. This paper might provide valuable results, but it is distinguished more by what it doesn’t say than by what it does say.
About 20-25 years ago, many climate scientists felt the need to promote the alarmist view of climate change by claiming the warming of the 20th century was anomalous compared to the previous 2,000 years, and coincident with rising CO2 concentration; therefore, CO2 was the driving force for this warmth.
Groups of climate scientists, in frequent contact with one another, acted in concert, seemingly as a community, and did not respond legitimately to various criticisms of their work, and continued to use faulty procedures, promulgating unjustifiable results.
We can speculate on their motives. They might have had a true idealistic desire to save the world from what they believed was an impending catastrophe due to global warming, but that does not justify their behavior.
Disclaimer
This paper derives from a chapter in my 2018 book “Assessing Climate Change” – my Reference [33Rapp D. Assessing climate change. 3rd ed. Heidelberg (Germany): Springer-Praxis Books; 2018.]. Although the book material was completely rearranged, modified, and new material added to, the overlap between this paper and my book chapter is significant. If the usual rules regarding self-plagiarism were applied, this paper would not be published. However, Mark Israel, a noted authority on self-plagiarism, wrote an article “Self-plagiarism: When is re-purposing text ethically justifiable?”* He asserted “It may be appropriate to publish similar articles in different journals in order to ask different research questions, link to different literatures or reach new and different audiences”. The book chapter was part of a lengthy, expensive book that reached a small audience, while it can reasonably be expected that the published paper will reach at least 100 times more viewers (based on data for my recent publications). This story began in 1998 and it culminated in 2025. I think it is important at this juncture to publish the history of how climate science was conducted by climate scientists at a time when climate alarmism was emerging.
Mann ME, Bradley RS, Hughes MK. Global-scale temperature patterns and climate forcing over the past six centuries. Nature. 1998 Apr 23;392(6678):779–87. https://doi.org/10.1038/33859.
Mann ME, Bradley RS, Hughes MK. Northern Hemisphere temperatures during the past millennium: Inferences, uncertainties, and limitations. Geophys Res Lett. 1999 Apr 1;26(6):759–62. https://doi.org/10.1029/1999GL900070.
Mann ME, Jones PD. Global surface temperatures over the past two millennia. Geophys Res Lett. 2003 Jul 1;30(15):1820. https://doi.org/10.1029/2003GL017814.
Mann ME, Zhang Z, Hughes MK, Bradley RS, Miller SK, Rutherford S, Ni F. Proxy-based reconstructions of hemispheric and global surface temperature variations over the past two millennia. Proc Natl Acad Sci U S A. 2008 Sep 9;105(36):13252-7. doi: 10.1073/pnas.0805721105. Epub 2008 Sep 2. PMID: 18765811; PMCID: PMC2527990.
Jones PD, Osborn TJ, Briffa KR. The evolution of climate over the last millennium. Science. 2001 Apr 27;292(5517):662-7. doi: 10.1126/science.1059126. PMID: 11326088.
Esper J, Wilson RJS, Frank DC, Moberg A, Wanner H, Luterbacher J. Climate: Past ranges and future changes. Quat Sci Rev. 2005;24(18–19):2164–6. https://doi.org/10.1016/j.quascirev.2005.07.001.
Moberg A, Sonechkin DM, Holmgren K, Datsenko NM, Karlén W, Lauritzen SE. Highly variable Northern Hemisphere temperatures reconstructed from low- and high-resolution proxy data. Nature. 2005 Feb 10;433(7026):613-7. doi: 10.1038/nature03265. Erratum in: Nature. 2006 Feb 23;439(7079):1014. Lauritzen, Stein-Erik [added]. PMID: 15703742.
von Storch H, Zorita E, Jones JM, Dimitriev Y, González-Rouco F, Tett SF. Reconstructing past climate from noisy data. Science. 2004 Oct 22;306(5696):679-82. doi: 10.1126/science.1096109. Epub 2004 Sep 30. PMID: 15459344.
Juckes MN, Allen MR, Briffa KR, Esper J, Hegerl GC, Moberg A, Osborn TJ, Weber SL, Zorita E. Millennial temperature reconstruction intercomparison and evaluation. Clim Past Discuss. 2006;2:1001–49.
Juckes MN, Allen MR, Briffa KR, Esper J, Hegerl GC, Moberg A, Osborn TJ, Weber SL, Zorita E. Millennial temperature reconstruction intercomparison and evaluation. Clim Past. 2007;3:591–609.
Esper J, Cook ER, Schweingruber FH. Low-frequency signals in long tree-ring chronologies for reconstructing past temperature variability. Science. 2002 Mar 22;295(5563):2250-3. doi: 10.1126/science.1066208. PMID: 11910106.
Ross M. What is the ‘Hockey Stick’ Debate About?, 2005. online at https://www.rossmckitrick.com/uploads/4/8/0/8/4808045/mckitrick-hockeystick.pdf
McIntyre S McKitrick R. “Corrections to the Mann et al. (1998) ‘Proxy data based and Northern Hemispheric average temperature series’,” Energy and Environment. 2003; 14: 751–771. https://doi.org/10.1260/095830503322793632.
Ross MT. The Mann et al. Northern Hemisphere Climate Index, edited by P. J. Michaels, Rowman and Littlefield, New York. 2005a.
McIntyre S, McKitrick R. Hockey Sticks, Principal Components and Spurious Significance, Geophysical Research Letters 32, L03710, 2005. https://doi.org/10.1029/2004GL021750.
McIntyre S, McKitrick R. Surface Temperature Reconstructions for the Past 1,000–2,000 Years, presentation to the National Academy of Sciences Expert Panel, Washington, D.C. (March 2). 2006.
McIntyre S, McKitrick R. The M&M Critique of the MBH98 Northern Hemisphere Climate Index: Update and Implications, Informal report. 2007. online at https://www.rossmckitrick.com/uploads/4/8/0/8/4808045/m_m.ee2005.pdf
McIntyre S. Climate Audit Website. 2025. online at http://www.climateaudit.org
Brian F. The Little Ice Age, Basic Books. 2000.
Crowley TJ, Lowery TS. How warm was the Medieval Warm Period? Ambio. 2000;29(1):51–4. https://doi.org/10.1579/0044-7447-29.1.51.
Grove JM. The Little Ice Age, Routledge, London, UK. 1988.
Grove JM. The initiation of the ‘Little Ice Age’ in regions around the North Atlantic, Climatic Change. 2001; 48:53–82.
Thorsteinn T. Stable isotopes and climate history from polar ice cores. 2012. http://www.ifa.hawaii.edu/UHNAI/NAIweb/presentations/26-Thorsteinsson-isotopeclimate.pdf
Willi D. Frozen Annals, Niels Bohr Institute, Copenhagen, Denmark. 2005.
Vinther BM, Jones PD, Briffa KR, Clausen HB, Andersen KK, Dahl-Jensen D, Johnsen SJ. Climatic signals in multiple highly resolved stable isotope records from Greenland. Quat Sci Rev. 2010;29(3–4):522–38. https://doi.org/10.1016/j.quascirev.2009.11.002.
Richey JN, Poore RZ, Hower BP, Quinn TM. 1400 yr multi-proxy record of climate variability from the northern Gulf of Mexico. Geology. 2007;35(5):423–6.
Loehle C. A 2000-year global temperature reconstruction based on non-tree ring proxies. Energy Environ. 2007;18(7–8):1049–58. https://doi.org/10.1260/0958305077826167.
Esper J, Frank DC, Timonen M, Zorita E, Wilson RJS, Luterbacher J, Holzkämper S, Fischer N, Wagner S, Nievergelt D, Verstege A, Büntgen U. Orbital forcing of tree-ring data. Nat Clim Chang. 2012 Jul 8. 10.1038/nclimate1589.
Esper J, Büntgen U, Timonen M, Frank DC. Variability and extremes of northern Scandinavian summer temperatures over the past two millennia. Glob Planet Change. 2012;88–89:1–9. https://doi.org/10.1016/j.gloplacha.2012.01.006.
Shindell D. Estimating the potential for twenty-first century sudden climate change. Philos Trans A Math Phys Eng Sci. 2007 Nov 15;365(1860):2675-94. doi: 10.1098/rsta.2007.2088. PMID: 17666384.
Weckström J, Korhola A, Erasto P, Holmström L. Temperature patterns over the past eight centuries in Northern Fennoscandia inferred from sedimentary diatoms. Quat Res. 2006;66(1):78–86. https://doi.org/10.1016/j.yqres.2006.01.005.
Rørvik KL, Grøsfjeld K, Hald M. A Late Holocene climate history from the Malangen fjord, North Norway, based on dinoflagellate cysts. Nor Geol Tidsskr. 2009;89:135–47.
Kobashi T, Severinghaus JP, Barnola JM, Kawamura K, Carter T, Nakaegawa T. Persistent multi-decadal Greenland temperature fluctuation through the last millennium. Clim Change. 2010;100(3–4):733–56.
Barclay DJ, Wiles GC, Calkin PE. Tree-ring crossdates for a First Millennium AD advance of Ebenkof Glacier, southern Alaska. Quat Res. 2009;71(1):22–6. doi:10.1016/j.yqres.2008.09.005.
Lüdecke HJ, Link R, Ewert FK. How natural is the recent centennial warming? An analysis of 2249 surface temperature records. Int J Mod Phys C. 2011;22(7):1139–54. 2011IJMPC..22.1139L.
Soon W, Baliunas S. Lessons and limits of climate history: Was the 20th century climate unusual? Informal report. Washington (DC): George C. Marshall Institute; 2003.
Soon W, Baliunas S. Reconstructing climatic and environmental changes of the past 1000 years: A reappraisal. Energy Environ. 2003;14(3):233–99. https://doi.org/10.1260/095830503765184619
Mann M, Ammann C, Bradley R, Briffa K, Jones P, Osborn T, Crowley T, Hughes M, Oppenheimer M, Overpeck J, Rutherford S, Trenberth K, Wigley T. Response to Soon et al's comment on 'On past temperatures and anomalous late-20th century warmth'. Eos. 2003 Oct 28;84(44):473–6.. https://doi.org/10.1029/2003EO440008
Crowley TJ, Lowery TS. How warm was the Medieval Warm Period? Ambio. 2000;29(1):51–4. https://doi.org/10.1579/0044-7447-29.1.51.
Hegerl GC, Crowley TJ, Allen M, Hyde WT, Pollack HN, Smerdon JS, Zorita E. Detection of human influence on a new, validated 1500-year temperature reconstruction. J Climate. 2007;20(5):650–66. https://doi.org/10.1175/JCLI4011.1.
Mosher S, Fuller TW. Climategate: The CRUTape letters. Self-published; 2010.
Wegman EJ, Scott DW, Said YH. Ad Hoc Committee Report on the hockey stick global climate reconstruction. Washington (DC): The Congressional Committee on Energy and Commerce; 2006 Jul 14. online at https://climateaudit.org/wp-content/uploads/2007/11/07142006_wegman_report.pdf
Esper J, Cook ER, Schweingruber FH. Low-frequency signals in long tree-ring chronologies for reconstructing past temperature variability. Science. 2002 Mar 22;295(5563):2250-3. doi: 10.1126/science.1066208. PMID: 11910106.
McIntyre S. Climate Audit Website. 2007. online at http://www.climateaudit.org
Montford AW. The Hockey Stick Illusion: Climategate and the Corruption of Science, Stacey International, London, UK. 2010.
Briffa KR, Osborn TJ, Schweingruber FH, Harris IC, Jones PD, Shiyatov SG, Vaganov EA. Low-frequency temperature variations from a northern tree-ring-density network. J Geophys Res. 2001;106(D3):2929–41. https://doi.org/10.1029/2000JD900617.
Briffa KR, Schweingruber FH, Jones PD, Osborn TJ, Shiyatov SG, Vaganov EA. Reduced sensitivity of recent tree-growth to temperature at high northern latitudes. Nature. 1998;391(6668):678–82. https://doi.org/10.1038/35596.
Jacoby GC, Lovelius NV, Shumilov OI, Raspopov OM, Karbainov JM, Frank DC. Long-term temperature trends and tree growth in the Taymir region of northern Siberia. Quat Res. 2000;53(3):312–8. https://doi.org/10.1006/qres.2000.2130.
D'Arrigo R, Wilson R, Jacoby G. Further discussion on: Tree-ring temperature reconstructions for the past millennium. 2006. https://www.ldeo.columbia.edu/res/fac/trl/downloads/Publications/D%27AWilsJac.nrc.followup.pdf
D'Arrigo R, Wilson R, Jacoby G. On the long-term context for late twentieth century warming. J Geophys Res Atmos. 2006;111(D03103) https://doi.org/10.1029/2005JD006352.
Wilmking M, Singh J. Eliminating the “divergence problem” at Alaska’s northern treeline. Clim Past Discuss. 2008;4:741–759. https://doi.org/10.5194/cpd-4-741-2008.
Burger G, Cubasch U. Are multiproxy climate reconstructions robust? Geophys Res Lett. 2005;32(L23711). https://doi.org/10.1029/2005GL024155.
Zorita, Eduardo; and Hans von Storch (2005), “Methodical aspects of reconstructing non-local historical temperatures,” Memorie della Societa` Astronomica Italiana 76, 794–801. (No DOI)
Zorita E, von Storch H. Methodical aspects of reconstructing non-local historical temperatures. Mem Soc Astron Ital. 2005;76:794–801. https://doi.org/10.1175/JCLI4171.1.
Tim B. The Science Isn’t Settled: The Limitations of Global Climate Models, Marshall Institute. 2007. online at https://www.proquest.com/docview/204095371?sourcetype=Scholarly%20Journals
Hill B. Commentary on the Hockey Stick. http://bishophill.squarespace.com/blog/2008/8/11/caspar-and-the-jesus-paper.html
Trenberth K. Communicating climate change: Some lessons from climategate. https://www2.cgd.ucar.edu/staff/trenbert/Presentations/ClimategateS.pdf
Dessler AE. Cloud variations and the Earth’s energy budget. 2011. https://agupubs.onlinelibrary.wiley.com/doi/full/10.1029/2011GL049236
Spencer RW, Braswell WD. On the Misdiagnosis of Climate Feedbacks from Variations in Earth's Radiant Energy Balance. Remote Sensing 3. 2011; 1603-1613. https://doi.org/10.3390/rs3081603.
Roger P.Sr. Comments on The Dessler 2011 GRL Paper. Cloud Variations And The Earth’s Energy Budget. 2011. https://pielkeclimatesci.wordpress.com/2011/09/06/comments-on-the-dessler-2011-grl-paper-cloud-variations-and-the-earths-energy-budget/.
McLean JD, de Freitas CR, Carter RM. Influence of the Southern Oscillation on tropospheric temperature. J Geophys Res. 2009;114(D14):D14104. DOI:10.1029/2009JD013006.
Foster G, Annan JD, Jones PD, Mann ME, Renwick J, Salinger J, Schmidt GA, Trenberth KE. Comment on “Influence of the Southern Oscillation on tropospheric temperature” by JD McLean, CR de Freitas, and RM Carter. J Geophys Res. 2010;115(D9):D09110. DOI:10.1029/2009JD012960.
McLean JD. Censorship at AGU: scientists denied the right of reply. 2010. http://icecap.us/images/uploads/McLeanetalSPPIpaper2Z-March24.pdf.
Douglass DH. El Niño Southern Oscillation: Magnitudes and asymmetry. J Geophys Res. 2010;115(D15):D15111.
Douglass DH, Christy JR, Pearson BD, Singer SF. A comparison of tropical temperature trends with model predictions. Int J Climatol. 2007;27(13):1653–64. DOI: 10.1002/joc.1651
Santer BD, Thorne PW, Haimberger L, Taylor KE, Wigley TML, Lanzante JR, Solomon S, Free M, Gleckler PJ, Jones PD, Karl TR, Klein SA, Mears C, Nychka D, Schmidt GA, Sherwood SC, Wentz FJ. Consistency of modeled and observed temperature trends in the tropical troposphere. Int J Climatol. 2008;28(13):1703–22.https://doi.org/10.1002/joc.1756.
Santer BD, Mears C, Doutriaux C, Caldwell P, Gleckler PJ, Wigley TML, Solomon S, Gillett NP, Ivanova D, Karl TR, Lanzante JR, Meehl GA, Stott PA, Taylor KE, Thorne PW, Wehner MF, Wentz FJ. Separating signal and noise in atmospheric temperature changes. J Geophys Res Atmos. 2011;116(D2):D22105. https://doi.org/10.1029/2011JD016263.
Rapp D. How increased CO2 warms the Earth—two contexts for the greenhouse gas effect. IgMinRes. 2024 Oct 24;2(10):854–9. IgMin ID: igmin259. DOI: 10.61927/igmin259; Available at: igmin.link/p259
Bouville M. Plagiarism: words and ideas. Sci Eng Ethics. 2008 Sep;14(3):311-22. doi: 10.1007/s11948-008-9057-6. PMID: 18368537.
Gelman A. Weggy time: A (conceptual) blast from the past. Stat Model Causal Inference Soc Sci. 2023. https://statmodeling.stat.columbia.edu/2023/08/18/weggy-time-a-conceptual-blast-from-the-past/
McIntyre S, McKitrick R. CLIMATEGATE untangling myth and reality ten years later. 2019. https://www.rossmckitrick.com/uploads/4/8/0/8/4808045/climategate.10yearsafter.pdf
PAGES 2k Consortium; Neukom R, Barboza LA, Erb MP, Shi F, Emile-Geay J, Evans MN, Franke J, Kaufman DS, Lücke L, Rehfeld K, Schurer A, Zhu F, Brönnimann S, Hakim GJ, Henley BJ, Ljungqvist FC, McKay N, Valler V, von Gunten L. Consistent multi-decadal variability in global temperature reconstructions and simulations over the Common Era. Nat Geosci. 2019 Jun 12;12(8):643-649. doi: 10.1038/s41561-019-0400-0. Epub 2019 Jul 24. PMID: 31372180; PMCID: PMC6675609.
Rapp D. Revisiting 2,000 Years of Climate Change (Bad Science and the “Hockey Stick”). IgMin Res. April 15, 2025; 3(4): 160-187. IgMin ID: igmin296; DOI:10.61927/igmin296; Available at: igmin.link/p296
Address Correspondence: Donald Rapp, 1445 Indiana Ave., South Pasadena, CA 91030, USA, Email: [email protected]
How to cite this article: Rapp D. Revisiting 2,000 Years of Climate Change (Bad Science and the “Hockey Stick”). IgMin Res. April 15, 2025; 3(4): 160-187. IgMin ID: igmin296; DOI:10.61927/igmin296; Available at: igmin.link/p296
Figure 2: The correlation between proxy and measured tempera...
Figure 3: Reconstructed temperatures since 1400 [1]. Note th...
Figure 4: Temperature anomaly vs. year since AD 1000. Adapte...
Figure 5: Some of the proxies used by Mann, et al. [5]....
Figure 6: Estimates of historical temperatures by Mann, et a...
Figure 7: Comparison of rework of the North American tree ne...
Figure 8: “Spaghetti chart” of individual proxies (excep...
Figure 9: Simple average of proxy data from Esper, Cook, and...
Figure 10: Temperature anomalies from MBH. The lower graph is...
Figure 11: Eight reconstructions of historical northern non-t...
Figure 12: Comparison of reconstructions. M-98-99 = Mann, et ...
Figure 13: “Trick” of replacing tree ring proxy by measur...
Figure 14: Temperature reconstructions. Adapted from Burger a...
Figure 15: Variation of Nino index from 1980 to 2010 [3]....
Figure 16: Integral of the Southern Oscillation Index (SOI) a...
Figure 17: Integral of Douglass’ modified El Niño index [6...
Figure 18: Comparison of Douglass’ modified El Niño index ...
Figure 19: Comparison of rework of the North American tree ne...
Table 1: Evidence of MWP and LIA from proxy studies....
Table 2: Number of proxies vs. earliest date according to M...
Mann ME, Bradley RS, Hughes MK. Global-scale temperature patterns and climate forcing over the past six centuries. Nature. 1998 Apr 23;392(6678):779–87. https://doi.org/10.1038/33859.
Mann ME, Bradley RS, Hughes MK. Northern Hemisphere temperatures during the past millennium: Inferences, uncertainties, and limitations. Geophys Res Lett. 1999 Apr 1;26(6):759–62. https://doi.org/10.1029/1999GL900070.
Mann ME, Jones PD. Global surface temperatures over the past two millennia. Geophys Res Lett. 2003 Jul 1;30(15):1820. https://doi.org/10.1029/2003GL017814.
Mann ME, Zhang Z, Hughes MK, Bradley RS, Miller SK, Rutherford S, Ni F. Proxy-based reconstructions of hemispheric and global surface temperature variations over the past two millennia. Proc Natl Acad Sci U S A. 2008 Sep 9;105(36):13252-7. doi: 10.1073/pnas.0805721105. Epub 2008 Sep 2. PMID: 18765811; PMCID: PMC2527990.
Jones PD, Osborn TJ, Briffa KR. The evolution of climate over the last millennium. Science. 2001 Apr 27;292(5517):662-7. doi: 10.1126/science.1059126. PMID: 11326088.
Esper J, Wilson RJS, Frank DC, Moberg A, Wanner H, Luterbacher J. Climate: Past ranges and future changes. Quat Sci Rev. 2005;24(18–19):2164–6. https://doi.org/10.1016/j.quascirev.2005.07.001.
Moberg A, Sonechkin DM, Holmgren K, Datsenko NM, Karlén W, Lauritzen SE. Highly variable Northern Hemisphere temperatures reconstructed from low- and high-resolution proxy data. Nature. 2005 Feb 10;433(7026):613-7. doi: 10.1038/nature03265. Erratum in: Nature. 2006 Feb 23;439(7079):1014. Lauritzen, Stein-Erik [added]. PMID: 15703742.
von Storch H, Zorita E, Jones JM, Dimitriev Y, González-Rouco F, Tett SF. Reconstructing past climate from noisy data. Science. 2004 Oct 22;306(5696):679-82. doi: 10.1126/science.1096109. Epub 2004 Sep 30. PMID: 15459344.
Juckes MN, Allen MR, Briffa KR, Esper J, Hegerl GC, Moberg A, Osborn TJ, Weber SL, Zorita E. Millennial temperature reconstruction intercomparison and evaluation. Clim Past Discuss. 2006;2:1001–49.
Juckes MN, Allen MR, Briffa KR, Esper J, Hegerl GC, Moberg A, Osborn TJ, Weber SL, Zorita E. Millennial temperature reconstruction intercomparison and evaluation. Clim Past. 2007;3:591–609.
Esper J, Cook ER, Schweingruber FH. Low-frequency signals in long tree-ring chronologies for reconstructing past temperature variability. Science. 2002 Mar 22;295(5563):2250-3. doi: 10.1126/science.1066208. PMID: 11910106.
Ross M. What is the ‘Hockey Stick’ Debate About?, 2005. online at https://www.rossmckitrick.com/uploads/4/8/0/8/4808045/mckitrick-hockeystick.pdf
McIntyre S McKitrick R. “Corrections to the Mann et al. (1998) ‘Proxy data based and Northern Hemispheric average temperature series’,” Energy and Environment. 2003; 14: 751–771. https://doi.org/10.1260/095830503322793632.
Ross MT. The Mann et al. Northern Hemisphere Climate Index, edited by P. J. Michaels, Rowman and Littlefield, New York. 2005a.
McIntyre S, McKitrick R. Hockey Sticks, Principal Components and Spurious Significance, Geophysical Research Letters 32, L03710, 2005. https://doi.org/10.1029/2004GL021750.
McIntyre S, McKitrick R. Surface Temperature Reconstructions for the Past 1,000–2,000 Years, presentation to the National Academy of Sciences Expert Panel, Washington, D.C. (March 2). 2006.
McIntyre S, McKitrick R. The M&M Critique of the MBH98 Northern Hemisphere Climate Index: Update and Implications, Informal report. 2007. online at https://www.rossmckitrick.com/uploads/4/8/0/8/4808045/m_m.ee2005.pdf
McIntyre S. Climate Audit Website. 2025. online at http://www.climateaudit.org
Brian F. The Little Ice Age, Basic Books. 2000.
Crowley TJ, Lowery TS. How warm was the Medieval Warm Period? Ambio. 2000;29(1):51–4. https://doi.org/10.1579/0044-7447-29.1.51.
Grove JM. The Little Ice Age, Routledge, London, UK. 1988.
Grove JM. The initiation of the ‘Little Ice Age’ in regions around the North Atlantic, Climatic Change. 2001; 48:53–82.
Thorsteinn T. Stable isotopes and climate history from polar ice cores. 2012. http://www.ifa.hawaii.edu/UHNAI/NAIweb/presentations/26-Thorsteinsson-isotopeclimate.pdf
Willi D. Frozen Annals, Niels Bohr Institute, Copenhagen, Denmark. 2005.
Vinther BM, Jones PD, Briffa KR, Clausen HB, Andersen KK, Dahl-Jensen D, Johnsen SJ. Climatic signals in multiple highly resolved stable isotope records from Greenland. Quat Sci Rev. 2010;29(3–4):522–38. https://doi.org/10.1016/j.quascirev.2009.11.002.
Richey JN, Poore RZ, Hower BP, Quinn TM. 1400 yr multi-proxy record of climate variability from the northern Gulf of Mexico. Geology. 2007;35(5):423–6.
Loehle C. A 2000-year global temperature reconstruction based on non-tree ring proxies. Energy Environ. 2007;18(7–8):1049–58. https://doi.org/10.1260/0958305077826167.
Esper J, Frank DC, Timonen M, Zorita E, Wilson RJS, Luterbacher J, Holzkämper S, Fischer N, Wagner S, Nievergelt D, Verstege A, Büntgen U. Orbital forcing of tree-ring data. Nat Clim Chang. 2012 Jul 8. 10.1038/nclimate1589.
Esper J, Büntgen U, Timonen M, Frank DC. Variability and extremes of northern Scandinavian summer temperatures over the past two millennia. Glob Planet Change. 2012;88–89:1–9. https://doi.org/10.1016/j.gloplacha.2012.01.006.
Shindell D. Estimating the potential for twenty-first century sudden climate change. Philos Trans A Math Phys Eng Sci. 2007 Nov 15;365(1860):2675-94. doi: 10.1098/rsta.2007.2088. PMID: 17666384.
Weckström J, Korhola A, Erasto P, Holmström L. Temperature patterns over the past eight centuries in Northern Fennoscandia inferred from sedimentary diatoms. Quat Res. 2006;66(1):78–86. https://doi.org/10.1016/j.yqres.2006.01.005.
Rørvik KL, Grøsfjeld K, Hald M. A Late Holocene climate history from the Malangen fjord, North Norway, based on dinoflagellate cysts. Nor Geol Tidsskr. 2009;89:135–47.
Kobashi T, Severinghaus JP, Barnola JM, Kawamura K, Carter T, Nakaegawa T. Persistent multi-decadal Greenland temperature fluctuation through the last millennium. Clim Change. 2010;100(3–4):733–56.
Barclay DJ, Wiles GC, Calkin PE. Tree-ring crossdates for a First Millennium AD advance of Ebenkof Glacier, southern Alaska. Quat Res. 2009;71(1):22–6. doi:10.1016/j.yqres.2008.09.005.
Lüdecke HJ, Link R, Ewert FK. How natural is the recent centennial warming? An analysis of 2249 surface temperature records. Int J Mod Phys C. 2011;22(7):1139–54. 2011IJMPC..22.1139L.
Soon W, Baliunas S. Lessons and limits of climate history: Was the 20th century climate unusual? Informal report. Washington (DC): George C. Marshall Institute; 2003.
Soon W, Baliunas S. Reconstructing climatic and environmental changes of the past 1000 years: A reappraisal. Energy Environ. 2003;14(3):233–99. https://doi.org/10.1260/095830503765184619
Mann M, Ammann C, Bradley R, Briffa K, Jones P, Osborn T, Crowley T, Hughes M, Oppenheimer M, Overpeck J, Rutherford S, Trenberth K, Wigley T. Response to Soon et al's comment on 'On past temperatures and anomalous late-20th century warmth'. Eos. 2003 Oct 28;84(44):473–6.. https://doi.org/10.1029/2003EO440008
Crowley TJ, Lowery TS. How warm was the Medieval Warm Period? Ambio. 2000;29(1):51–4. https://doi.org/10.1579/0044-7447-29.1.51.
Hegerl GC, Crowley TJ, Allen M, Hyde WT, Pollack HN, Smerdon JS, Zorita E. Detection of human influence on a new, validated 1500-year temperature reconstruction. J Climate. 2007;20(5):650–66. https://doi.org/10.1175/JCLI4011.1.
Mosher S, Fuller TW. Climategate: The CRUTape letters. Self-published; 2010.
Wegman EJ, Scott DW, Said YH. Ad Hoc Committee Report on the hockey stick global climate reconstruction. Washington (DC): The Congressional Committee on Energy and Commerce; 2006 Jul 14. online at https://climateaudit.org/wp-content/uploads/2007/11/07142006_wegman_report.pdf
Esper J, Cook ER, Schweingruber FH. Low-frequency signals in long tree-ring chronologies for reconstructing past temperature variability. Science. 2002 Mar 22;295(5563):2250-3. doi: 10.1126/science.1066208. PMID: 11910106.
McIntyre S. Climate Audit Website. 2007. online at http://www.climateaudit.org
Montford AW. The Hockey Stick Illusion: Climategate and the Corruption of Science, Stacey International, London, UK. 2010.
Briffa KR, Osborn TJ, Schweingruber FH, Harris IC, Jones PD, Shiyatov SG, Vaganov EA. Low-frequency temperature variations from a northern tree-ring-density network. J Geophys Res. 2001;106(D3):2929–41. https://doi.org/10.1029/2000JD900617.
Briffa KR, Schweingruber FH, Jones PD, Osborn TJ, Shiyatov SG, Vaganov EA. Reduced sensitivity of recent tree-growth to temperature at high northern latitudes. Nature. 1998;391(6668):678–82. https://doi.org/10.1038/35596.
Jacoby GC, Lovelius NV, Shumilov OI, Raspopov OM, Karbainov JM, Frank DC. Long-term temperature trends and tree growth in the Taymir region of northern Siberia. Quat Res. 2000;53(3):312–8. https://doi.org/10.1006/qres.2000.2130.
D'Arrigo R, Wilson R, Jacoby G. Further discussion on: Tree-ring temperature reconstructions for the past millennium. 2006. https://www.ldeo.columbia.edu/res/fac/trl/downloads/Publications/D%27AWilsJac.nrc.followup.pdf
D'Arrigo R, Wilson R, Jacoby G. On the long-term context for late twentieth century warming. J Geophys Res Atmos. 2006;111(D03103) https://doi.org/10.1029/2005JD006352.
Wilmking M, Singh J. Eliminating the “divergence problem” at Alaska’s northern treeline. Clim Past Discuss. 2008;4:741–759. https://doi.org/10.5194/cpd-4-741-2008.
Burger G, Cubasch U. Are multiproxy climate reconstructions robust? Geophys Res Lett. 2005;32(L23711). https://doi.org/10.1029/2005GL024155.
Zorita, Eduardo; and Hans von Storch (2005), “Methodical aspects of reconstructing non-local historical temperatures,” Memorie della Societa` Astronomica Italiana 76, 794–801. (No DOI)
Zorita E, von Storch H. Methodical aspects of reconstructing non-local historical temperatures. Mem Soc Astron Ital. 2005;76:794–801. https://doi.org/10.1175/JCLI4171.1.
Tim B. The Science Isn’t Settled: The Limitations of Global Climate Models, Marshall Institute. 2007. online at https://www.proquest.com/docview/204095371?sourcetype=Scholarly%20Journals
Hill B. Commentary on the Hockey Stick. http://bishophill.squarespace.com/blog/2008/8/11/caspar-and-the-jesus-paper.html
Trenberth K. Communicating climate change: Some lessons from climategate. https://www2.cgd.ucar.edu/staff/trenbert/Presentations/ClimategateS.pdf
Dessler AE. Cloud variations and the Earth’s energy budget. 2011. https://agupubs.onlinelibrary.wiley.com/doi/full/10.1029/2011GL049236
Spencer RW, Braswell WD. On the Misdiagnosis of Climate Feedbacks from Variations in Earth's Radiant Energy Balance. Remote Sensing 3. 2011; 1603-1613. https://doi.org/10.3390/rs3081603.
Roger P.Sr. Comments on The Dessler 2011 GRL Paper. Cloud Variations And The Earth’s Energy Budget. 2011. https://pielkeclimatesci.wordpress.com/2011/09/06/comments-on-the-dessler-2011-grl-paper-cloud-variations-and-the-earths-energy-budget/.
McLean JD, de Freitas CR, Carter RM. Influence of the Southern Oscillation on tropospheric temperature. J Geophys Res. 2009;114(D14):D14104. DOI:10.1029/2009JD013006.
Foster G, Annan JD, Jones PD, Mann ME, Renwick J, Salinger J, Schmidt GA, Trenberth KE. Comment on “Influence of the Southern Oscillation on tropospheric temperature” by JD McLean, CR de Freitas, and RM Carter. J Geophys Res. 2010;115(D9):D09110. DOI:10.1029/2009JD012960.
McLean JD. Censorship at AGU: scientists denied the right of reply. 2010. http://icecap.us/images/uploads/McLeanetalSPPIpaper2Z-March24.pdf.
Douglass DH. El Niño Southern Oscillation: Magnitudes and asymmetry. J Geophys Res. 2010;115(D15):D15111.
Douglass DH, Christy JR, Pearson BD, Singer SF. A comparison of tropical temperature trends with model predictions. Int J Climatol. 2007;27(13):1653–64. DOI: 10.1002/joc.1651
Santer BD, Thorne PW, Haimberger L, Taylor KE, Wigley TML, Lanzante JR, Solomon S, Free M, Gleckler PJ, Jones PD, Karl TR, Klein SA, Mears C, Nychka D, Schmidt GA, Sherwood SC, Wentz FJ. Consistency of modeled and observed temperature trends in the tropical troposphere. Int J Climatol. 2008;28(13):1703–22.https://doi.org/10.1002/joc.1756.
Santer BD, Mears C, Doutriaux C, Caldwell P, Gleckler PJ, Wigley TML, Solomon S, Gillett NP, Ivanova D, Karl TR, Lanzante JR, Meehl GA, Stott PA, Taylor KE, Thorne PW, Wehner MF, Wentz FJ. Separating signal and noise in atmospheric temperature changes. J Geophys Res Atmos. 2011;116(D2):D22105. https://doi.org/10.1029/2011JD016263.
Rapp D. How increased CO2 warms the Earth—two contexts for the greenhouse gas effect. IgMinRes. 2024 Oct 24;2(10):854–9. IgMin ID: igmin259. DOI: 10.61927/igmin259; Available at: igmin.link/p259
Bouville M. Plagiarism: words and ideas. Sci Eng Ethics. 2008 Sep;14(3):311-22. doi: 10.1007/s11948-008-9057-6. PMID: 18368537.
Gelman A. Weggy time: A (conceptual) blast from the past. Stat Model Causal Inference Soc Sci. 2023. https://statmodeling.stat.columbia.edu/2023/08/18/weggy-time-a-conceptual-blast-from-the-past/
McIntyre S, McKitrick R. CLIMATEGATE untangling myth and reality ten years later. 2019. https://www.rossmckitrick.com/uploads/4/8/0/8/4808045/climategate.10yearsafter.pdf
PAGES 2k Consortium; Neukom R, Barboza LA, Erb MP, Shi F, Emile-Geay J, Evans MN, Franke J, Kaufman DS, Lücke L, Rehfeld K, Schurer A, Zhu F, Brönnimann S, Hakim GJ, Henley BJ, Ljungqvist FC, McKay N, Valler V, von Gunten L. Consistent multi-decadal variability in global temperature reconstructions and simulations over the Common Era. Nat Geosci. 2019 Jun 12;12(8):643-649. doi: 10.1038/s41561-019-0400-0. Epub 2019 Jul 24. PMID: 31372180; PMCID: PMC6675609.


 扫描并获取链接


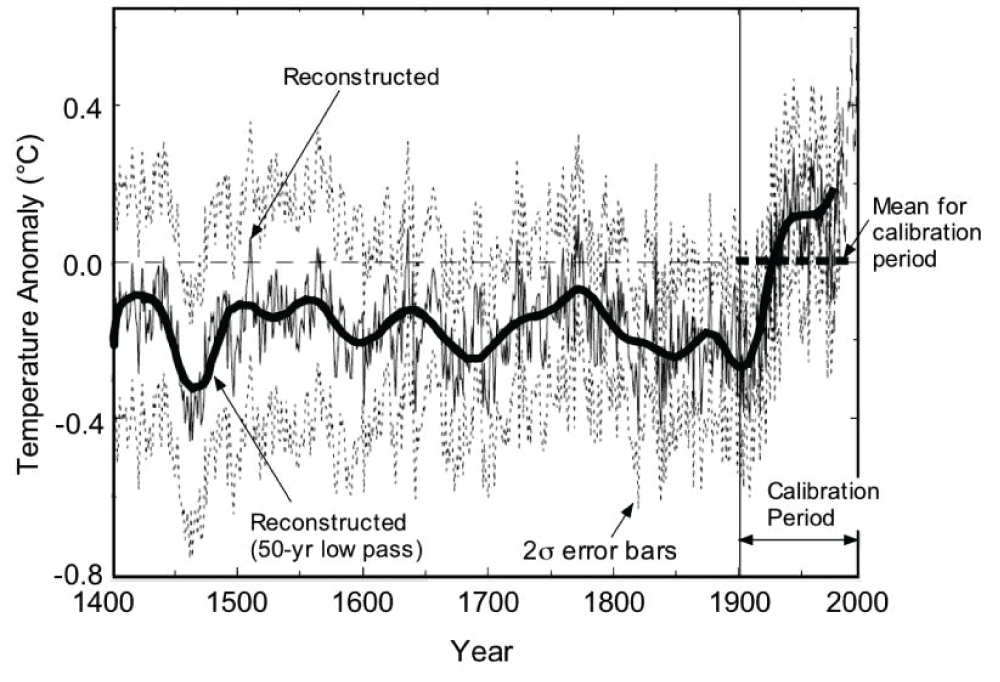
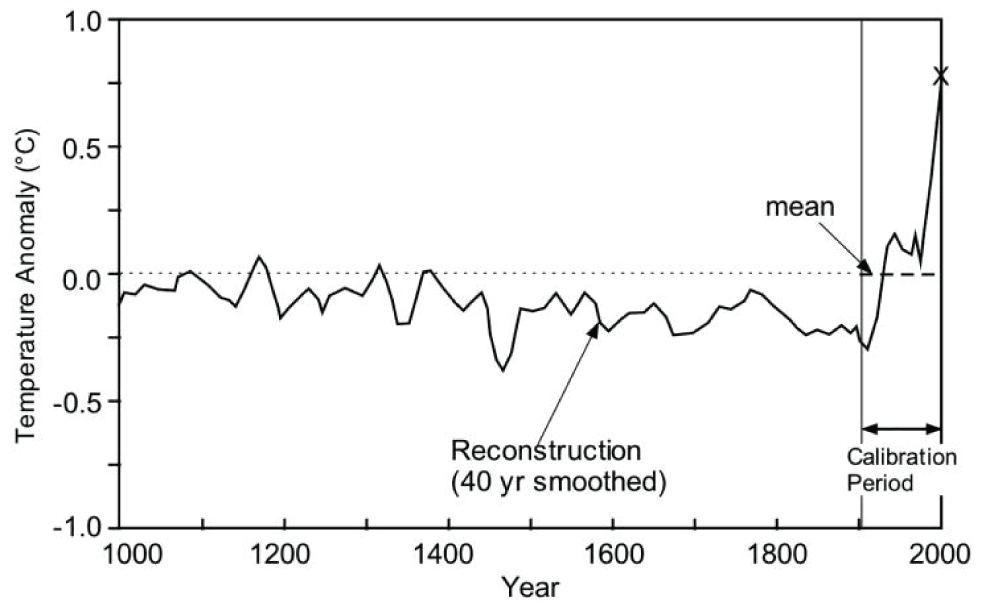
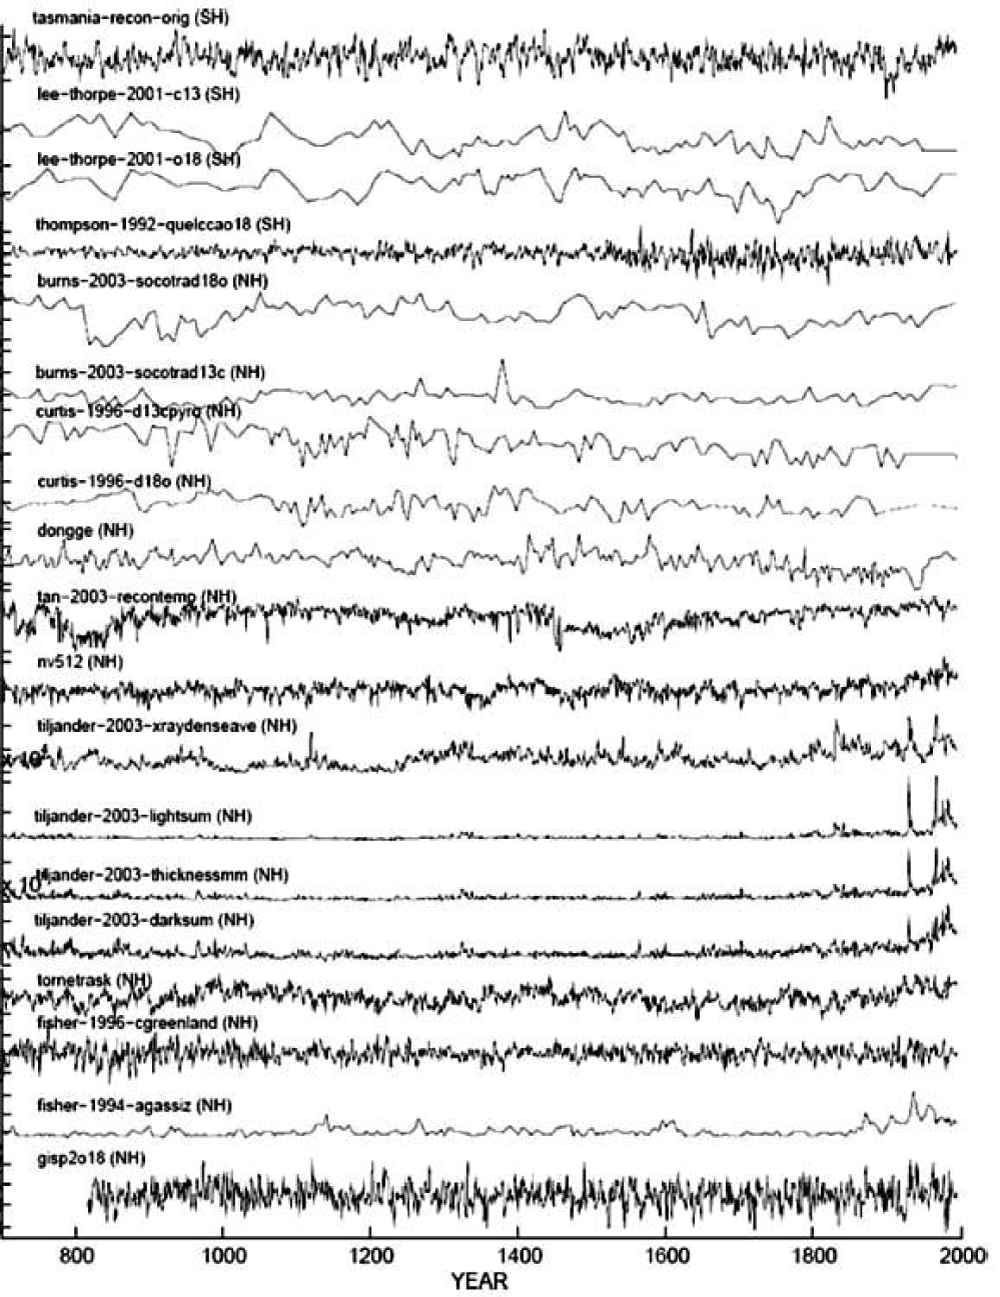
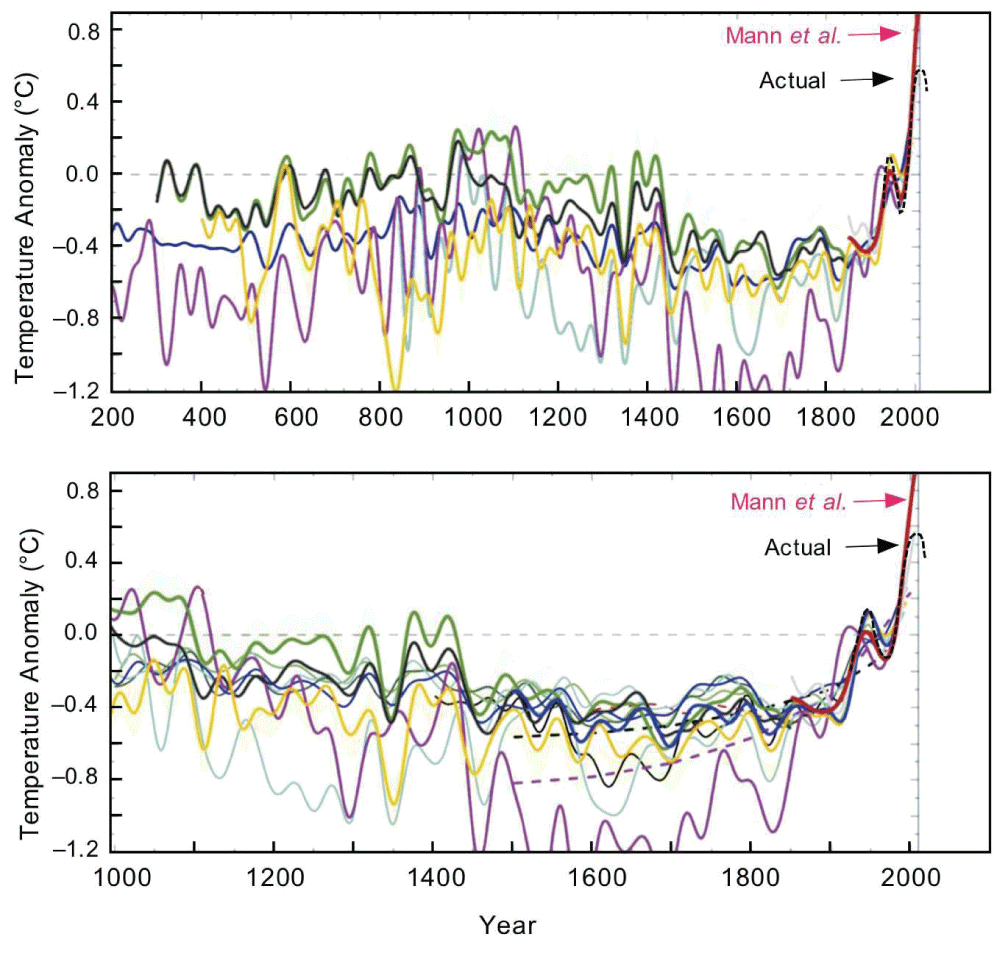

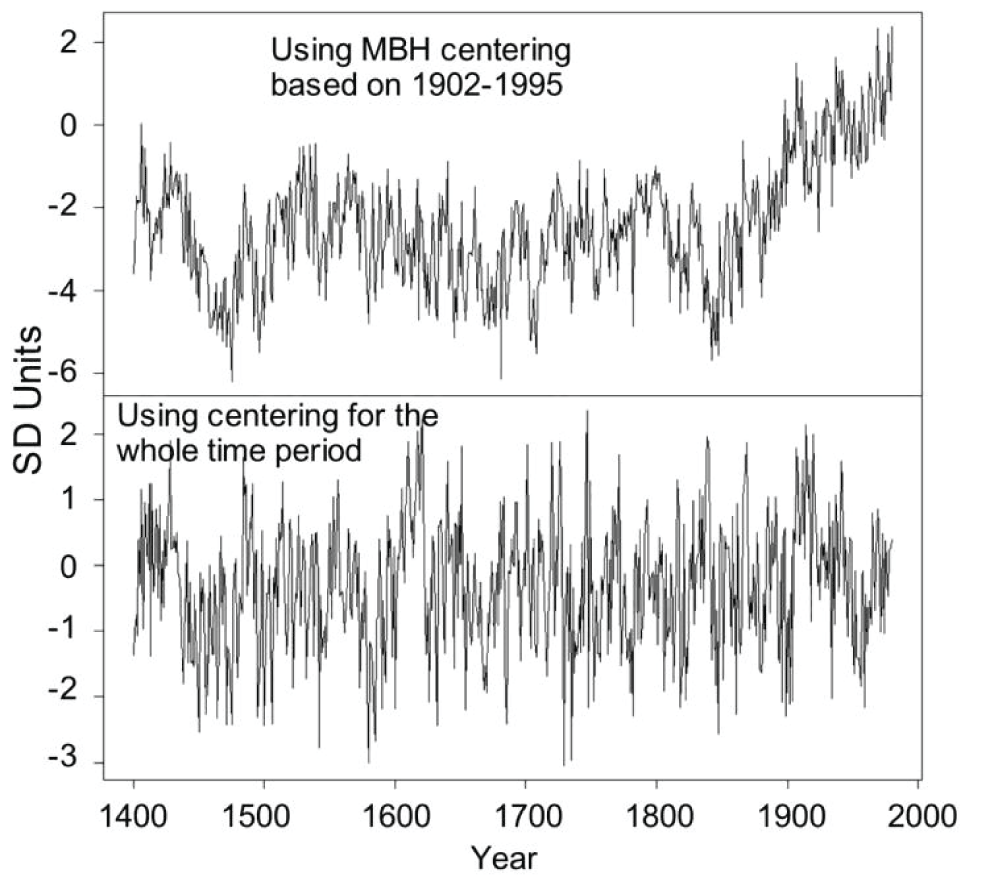
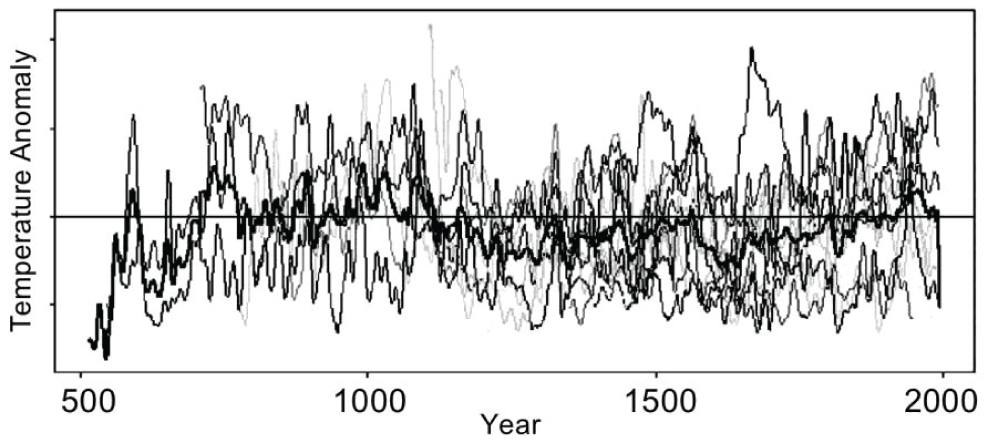
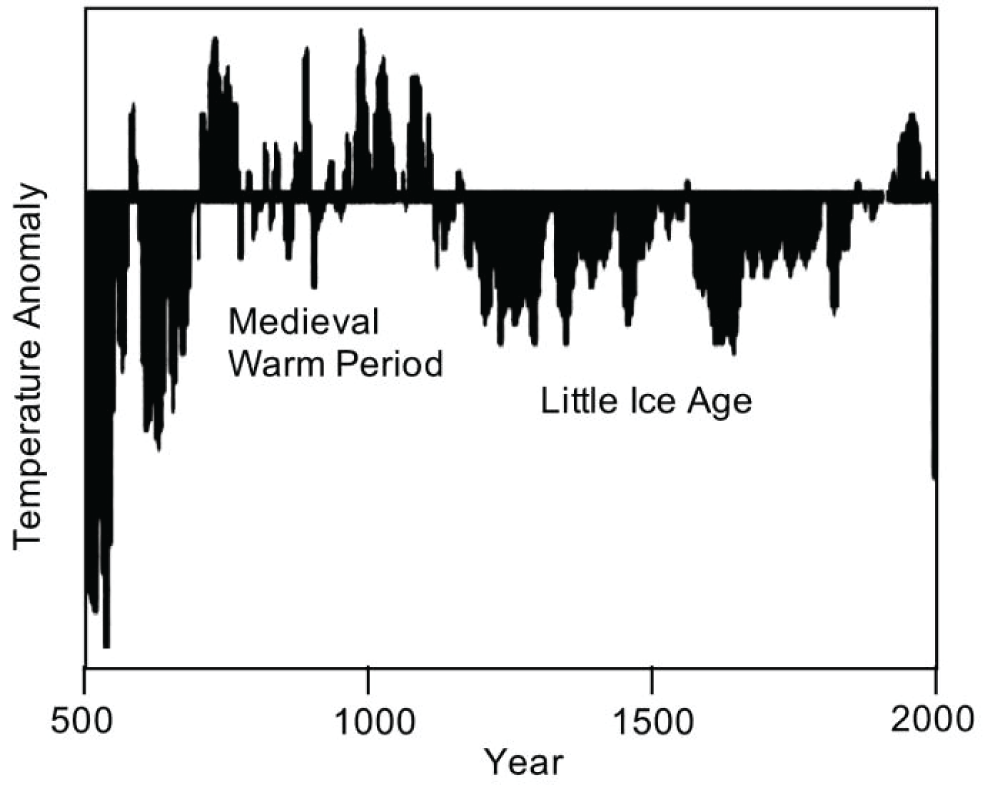
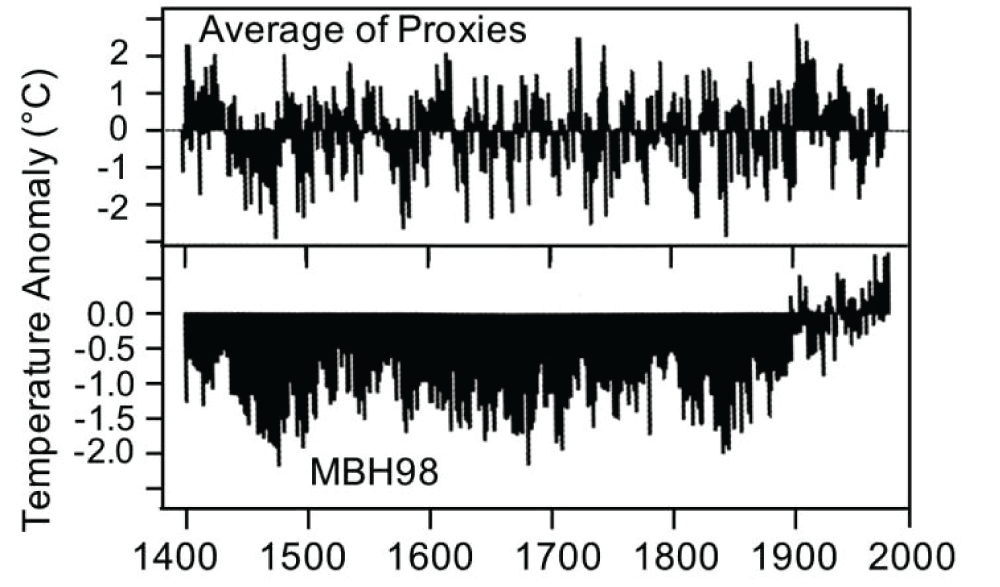
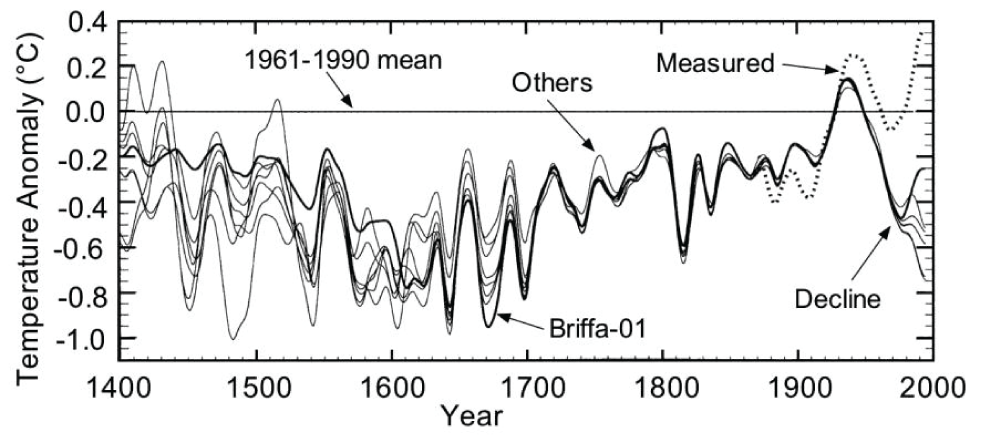
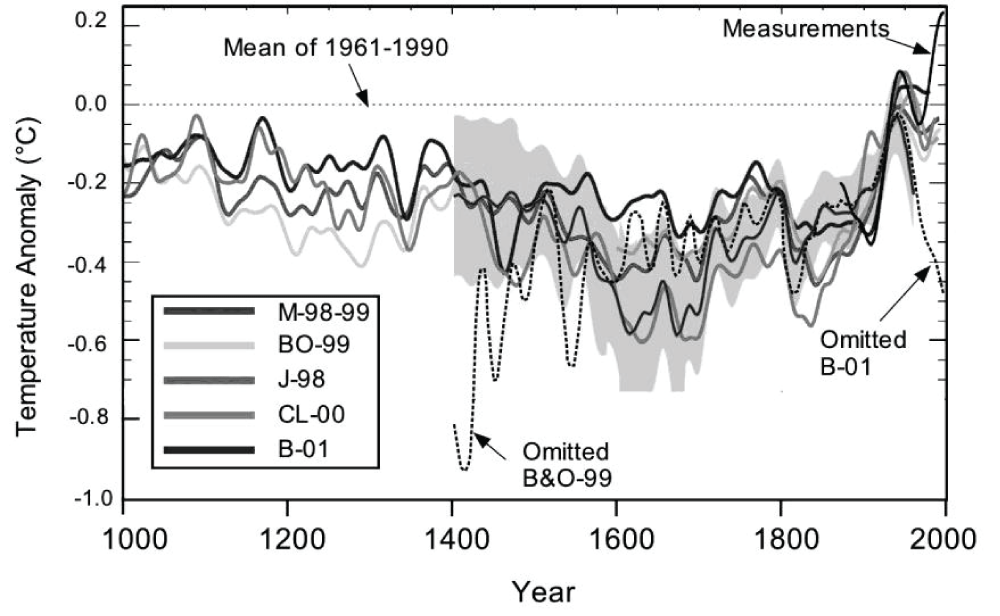


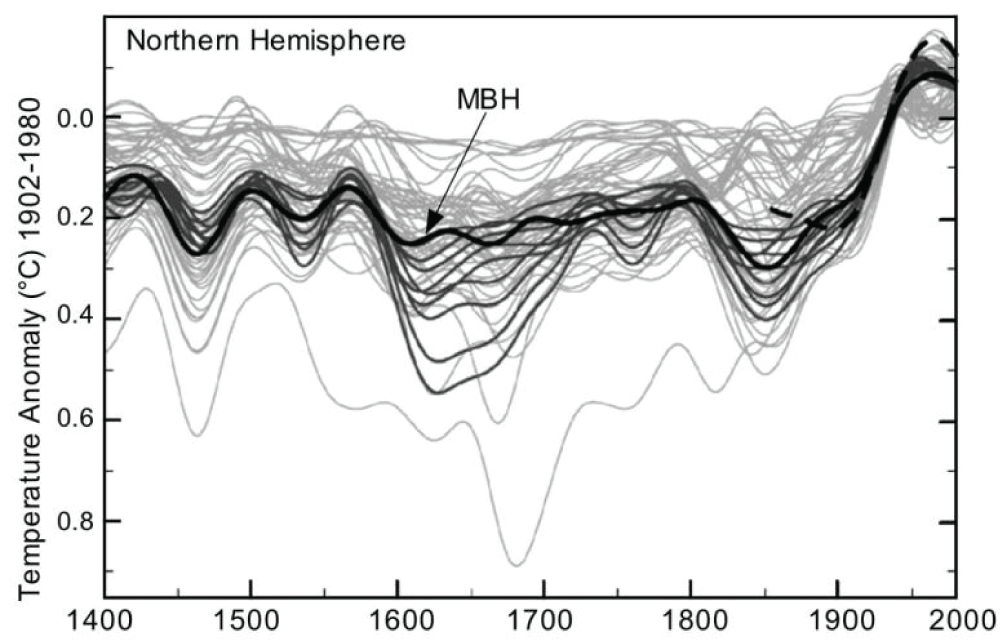
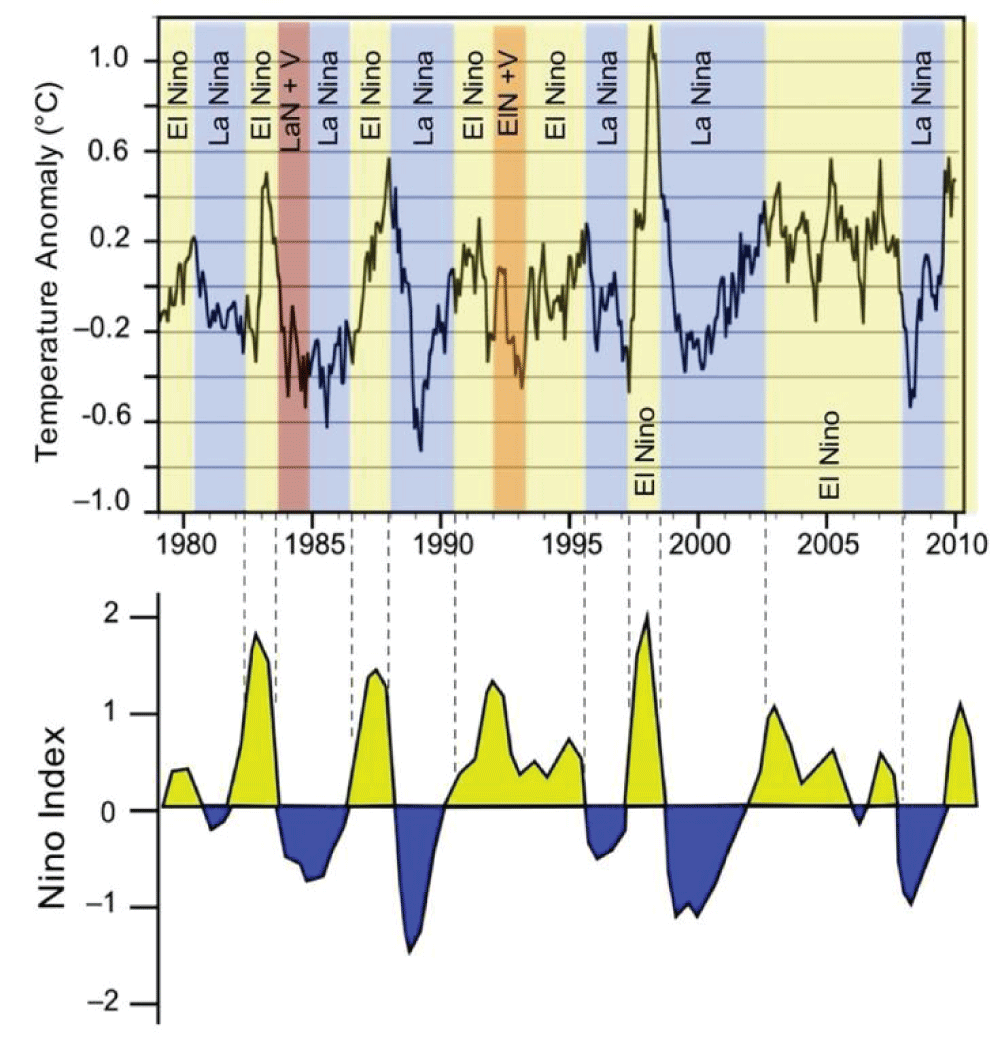
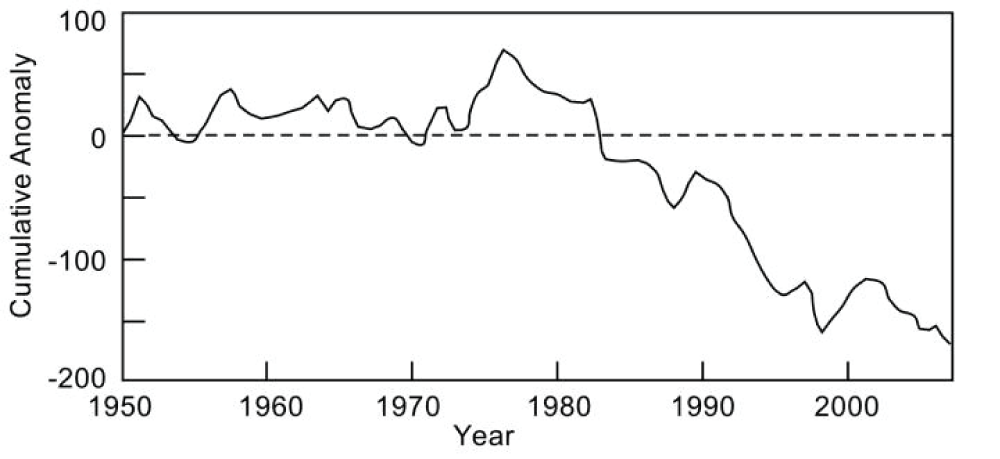
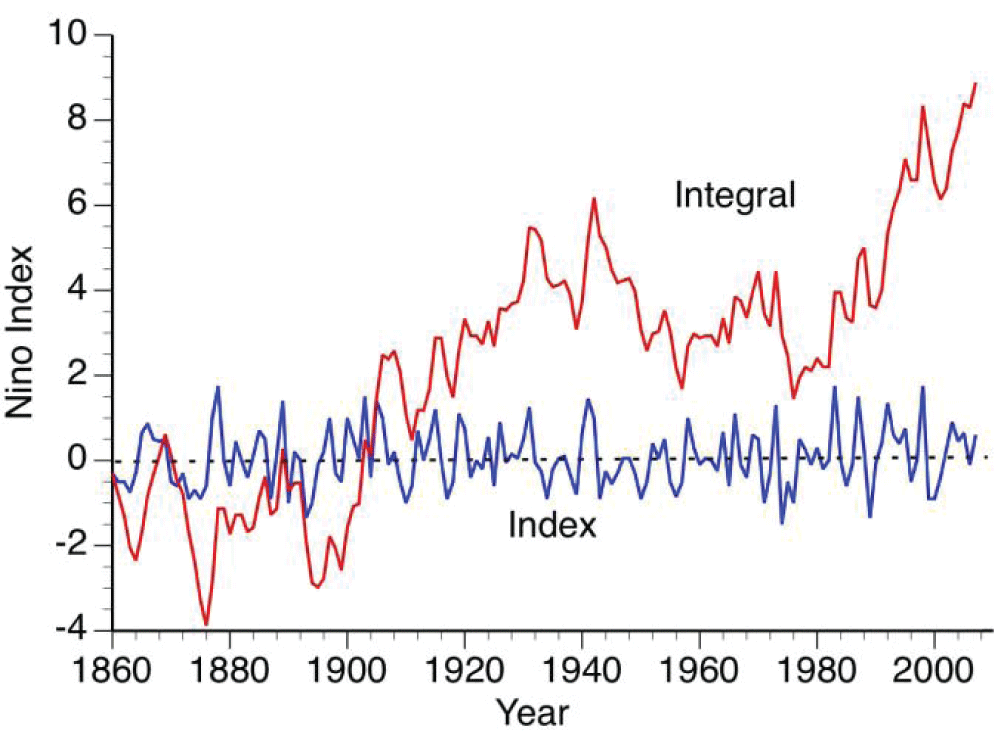
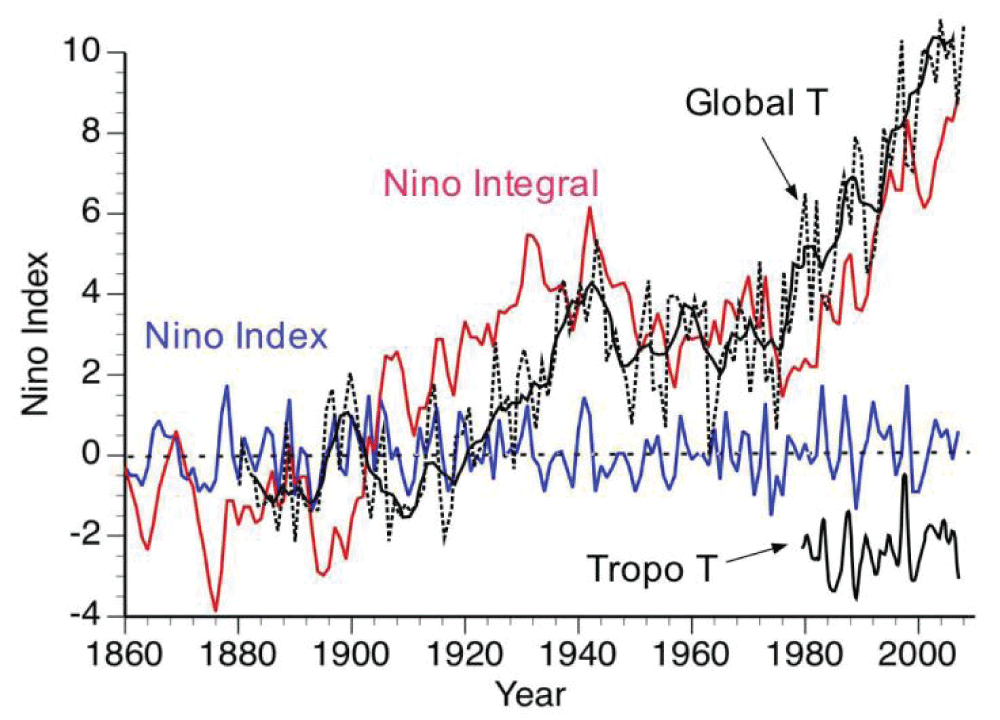
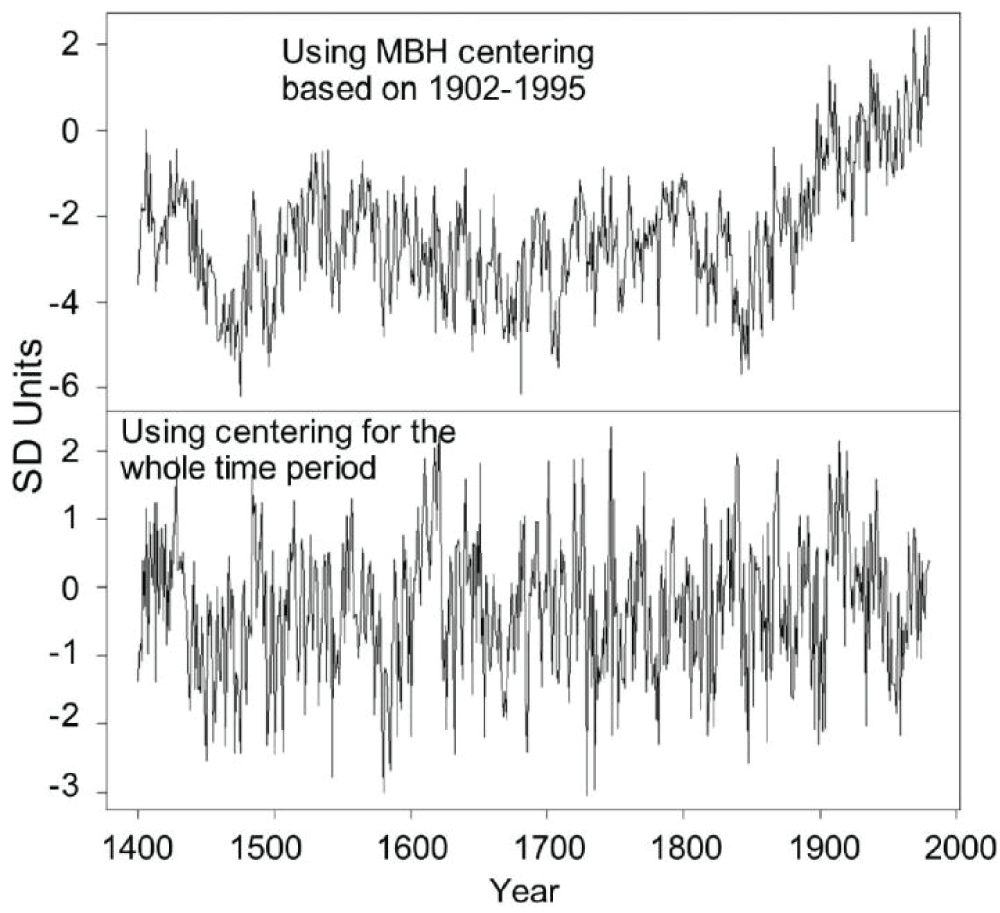

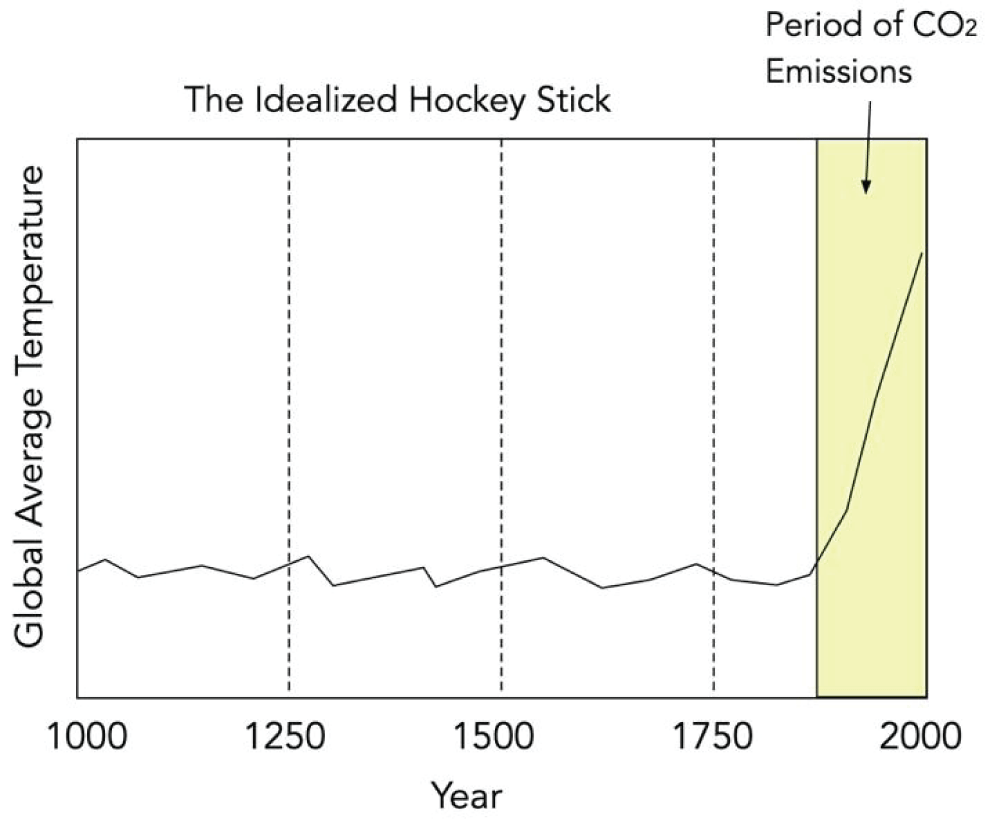
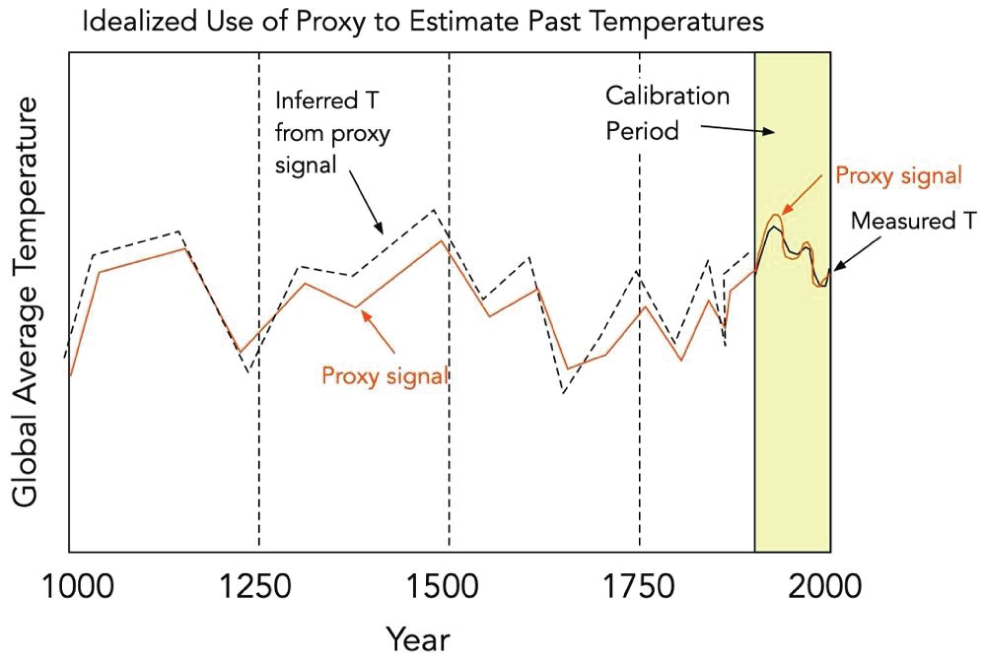
![Reconstructed temperatures since 1400 [1]. Note that the mean is for 1902–1980. Also note that the 2σ error bars are so wide that they could hide almost any imaginable temperature curve [1].](https://www.igminresearch.cn/articles/figures/igmin296/igmin296.g003.png)
![Temperature anomaly vs. year since AD 1000. Adapted from Mann, Bradley, and Hughes [2]. The X at the far right is their estimate for 1998. Note that the mean is for 1902–1980.](https://www.igminresearch.cn/articles/figures/igmin296/igmin296.g004.png)
![Some of the proxies used by Mann, et al. [5].](https://www.igminresearch.cn/articles/figures/igmin296/igmin296.g005.png)
![Estimates of historical temperatures by Mann, et al. and others [5]. Mann, et al. exaggerated the temperature rise at the far right. The actual temperature change is shown as a black dashed line. In either case, substituting measured temperature for modeled temperature hides the model where it fails.](https://www.igminresearch.cn/articles/figures/igmin296/igmin296.g006.png)
![Comparison of rework of the North American tree network first principal component (PC1) using MBH centering on the calibration period vs. using centering across the entire time span of the data set. The hockey stick is shown to be an artifice of the procedure. Adapted from Wegman, Scott, and Said [43].](https://www.igminresearch.cn/articles/figures/igmin296/igmin296.g007.png)
![“Spaghetti chart” of individual proxies (except Mongolia). Adapted from McIntyre [45].](https://www.igminresearch.cn/articles/figures/igmin296/igmin296.g008.png)
![Simple average of proxy data from Esper, Cook, and Schweingruber [44]. Adapted from McIntyre [45].](https://www.igminresearch.cn/articles/figures/igmin296/igmin296.g009.png)
![Temperature anomalies from MBH. The lower graph is the result of MBH98 while the upper graph is a simple average of their proxies [46].](https://www.igminresearch.cn/articles/figures/igmin296/igmin296.g010.png)
![Eight reconstructions of historical northern non-tropical summer temperatures using various procedures. The heavy line (Briffa-01) is “preferred” [47].](https://www.igminresearch.cn/articles/figures/igmin296/igmin296.g011.png)
![Comparison of reconstructions. M-98-99 = Mann, et al. [1]. BO-99 = Briffa and Osborne (1999). J-98 = Jones, et al. (1998). CL-00 = Crowley and Lowery [21]. B-01 = Briffa, et al. [47].](https://www.igminresearch.cn/articles/figures/igmin296/igmin296.g012.png)
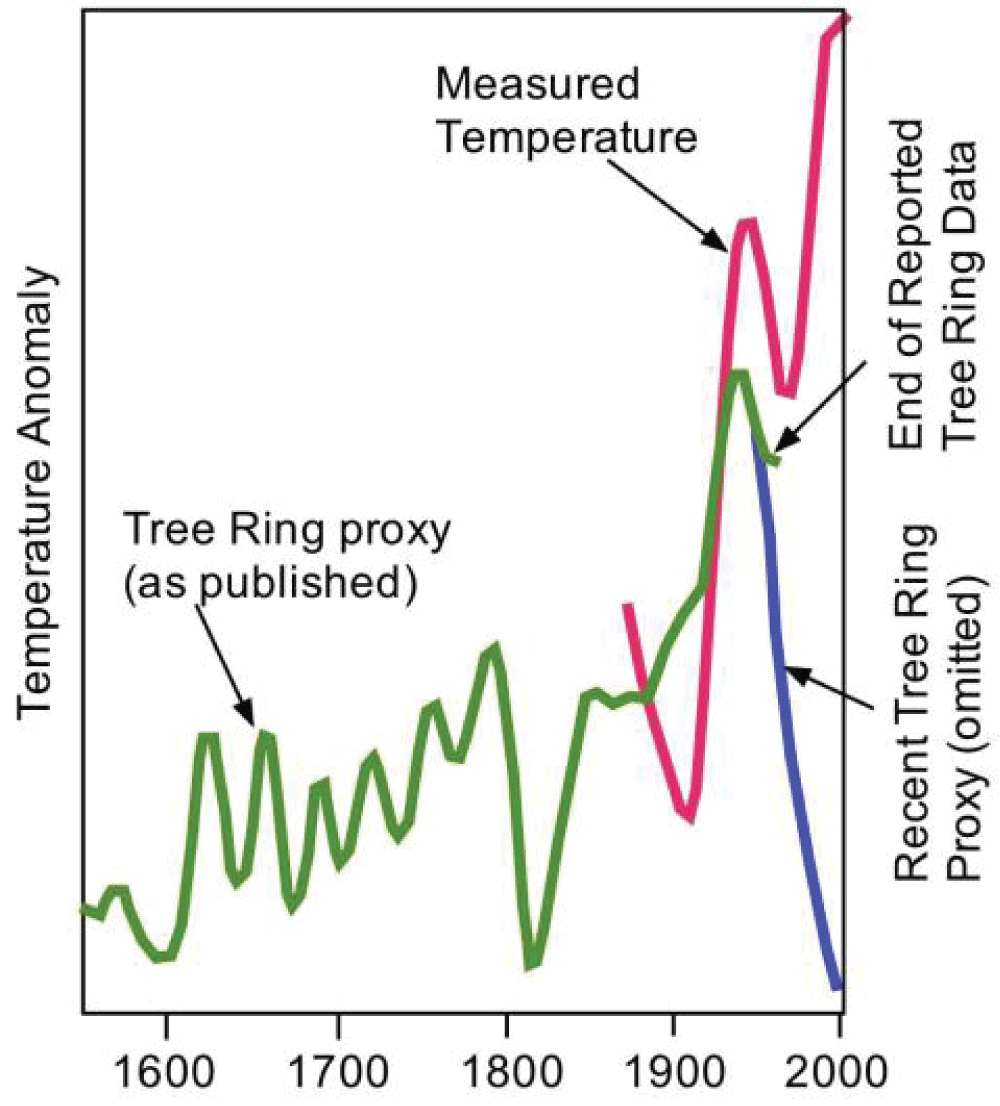
![Temperature reconstructions. Adapted from Burger and Cubasch [53].](https://www.igminresearch.cn/articles/figures/igmin296/igmin296.g014.png)
![Variation of Nino index from 1980 to 2010 [3].](https://www.igminresearch.cn/articles/figures/igmin296/igmin296.g015.png)
![Integral of the Southern Oscillation Index (SOI) anomaly from 1950 to 2000. (Negative values of SOI indicate predominance of El Niños) [3].](https://www.igminresearch.cn/articles/figures/igmin296/igmin296.g016.png)
![Integral of Douglass’ modified El Niño index [65].](https://www.igminresearch.cn/articles/figures/igmin296/igmin296.g017.png)
![Comparison of Douglass’ modified El Niño index and its integral with measured global surface temperature anomalies and tropospheric temperature anomalies [3,65].](https://www.igminresearch.cn/articles/figures/igmin296/igmin296.g018.png)
![Comparison of rework of the North American tree network PC1 using MBH centering vs. using centering across the entire time span of the data set. The hockey stick is shown to be an artifice. Adapted from Wegman, Scott, and Said [43].](https://www.igminresearch.cn/articles/figures/igmin296/igmin296.g019.png)

![<p>Number of proxies <em>vs.</em> earliest date according to Mann, Bradley, and Hughes [1].</p>](https://www.igminresearch.cn/articles/fulltext/table_images/igmin296/Table2.png)